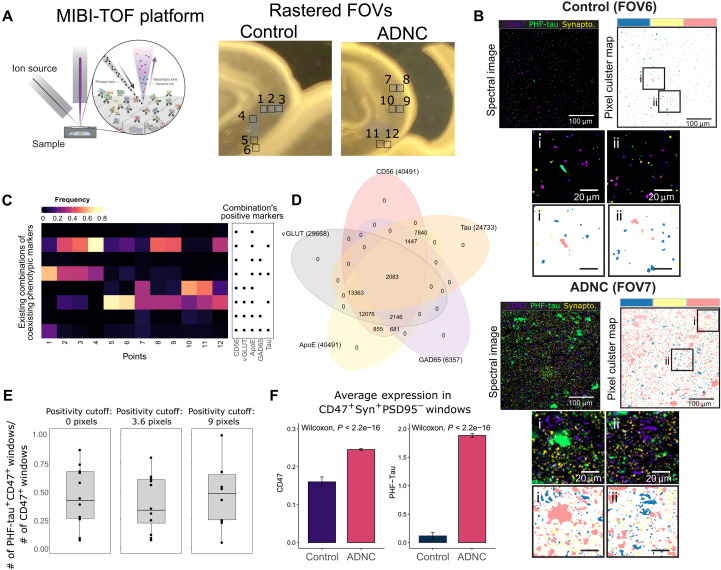
Fig. 5. Analysis of MIBI-TOF images supports SynTOF findings by suggesting high colocalization of phenotypic markers, colocalization of CD47 and PHF-tau, and higher CD47 expression in ADNC.
(A) Illustration of MIBI-TOF and the sampled locations of the FOVs from CA1 sector of the hippocampus. (B) Examples of MIBI-TOF image FOV from Control and ADNC. The spectral images are overlaid with CD47, PHF-tau, and synaptophysin channels for identification of likely synapses (left) with corresponding areas colored by CD47-positive (blue), PHF-tau–positive (pink), and synaptophysin-positive (yellow) clusters obtained from self-organizing maps clustering (right). Bottom, smaller panels show zoomed-in images within the rectangles. (C) Heatmap showing existing combinations of positive MIBI’s phenotypic markers found from aggregated sliding windows, with colors representing a fraction of positivity over the number of presynaptic windows defined as containing CD47+Synaptophysin+PSD95−. (D) Venn diagram summarizing the intersected expression of the phenotypic markers. The number in the parenthesis indicates the total number of positive windows. (E) Boxplots showing the fraction of PHF-tau and CD47 colocalization within a window over different numbers of pixel cutoffs used for defining marker positivity. (F) Barplots showing higher average (±SEM) CD47 and PHF-tau expressions in ADNC based on all presynaptic windows in all points.

