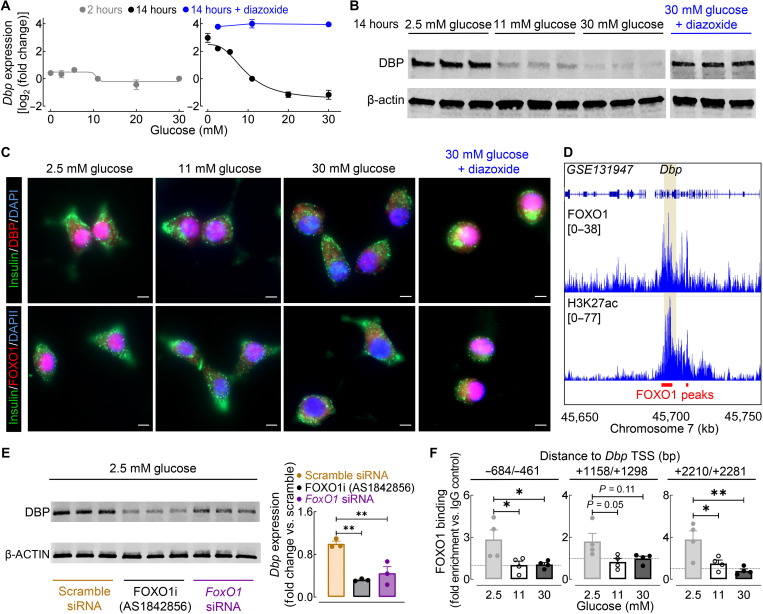
Fig. 10. Glucose regulates β cell Dbp expression through modulation of FoxO1.
(A) Dbp mRNA expression of INS-1 832/13 β cells cultured in varying glucose concentrations (0 to 30 mM glucose) for either 2 hours (left, gray) or 14 hours (right, black). A subset of β cells was treated with 2.5, 11, or 30 mM glucose + 250 μM diazoxide for 14 hours (blue; n = 3 to 4 experiments per condition/time). (B) DBP and β-actin protein expression in INS-1 832/13 β cells treated with 2.5, 11, 30, or 30 mM glucose + 250 μM diazoxide for 14 hours (n = 3 experiments per condition). (C) Representative examples of INS-1 832/13 β cells treated for 14 hours with 2.5, 11, 30, or 30 mM glucose + 250 μM diazoxide (out of n = 3 experiments per condition) and immunostained for DBP (red, top) or FOXO1 (red, bottom), insulin (green), and DAPI nuclear stain (blue). Scale bars, 5 μm (×40 magnification). (D) Genome browser tracks of mouse islet FOXO1 and H3K27ac ChIP-seq from GSE131947 (55). FOXO1 binding sites are highlighted in red with the Dbp locus highlighted in yellow. (E) DBP and β-actin protein expression in INS-1 832/13 β cells transfected with FoxO1 or scramble siRNA and exposed to 2.5 mM glucose + dimethyl sulfoxide vehicle or 100 nM AS1842856 for 14 hours (left). Quantification of DBP expression is normalized to scramble siRNA control (right; n = 3 experiments per condition). (F) ChIP qPCR analysis of FOXO1 binding to three regions adjacent to the Dbp TSS in INS-1 832/13 β cells cultured for 14 hours in 2.5, 11, or 30 mM glucose (n = 4 experiments per condition). *P < 0.05 and **P < 0.01 denote statistical significance (one-way ANOVA with Tukey post hoc test). Values represent means ± SEM.

