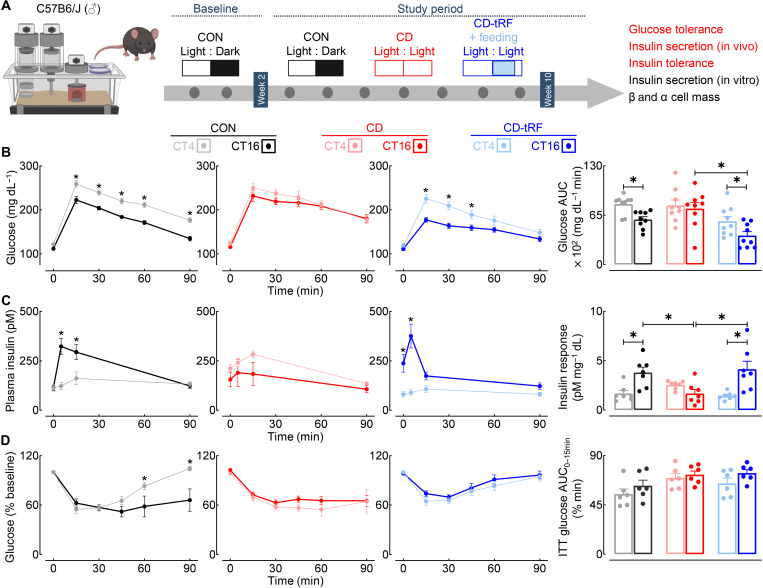
Fig. 2. tRF preserves diurnal glucose tolerance and β cell function under conditions of global circadian disruption in mice.
(A) Overview of study design. Diurnal glucose tolerance, in vivo and in vitro glucose-stimulated insulin secretion (GSIS), insulin tolerance, and β/α cell mass were assessed in CON, CD, and CD-tRF mice at the end of the 8-week study period. Experimental parameters assessed and displayed in the figure are highlighted in red. (B) Blood glucose concentrations sampled during intraperitoneal glucose tolerance tests (GTT) and corresponding glucose area under the curve (AUC) during GTT performed at CT4 and CT16 in CON (gray/black), CD (pink/red), and CD-tRF (light blue/dark blue) mice (n = 9 mice per condition). *P < 0.05 denotes statistical significance for CT4 versus CT16 (paired, two-tailed Student’s t test with Holm-Sidak correction for intragroup comparison and one-way ANOVA with Tukey correction for intergroup comparison). (C) Plasma insulin concentrations collected at 0, 5, 15, and 90 min after glucose administration during GTT and corresponding insulin response (expressed as insulin AUC/glucose AUC during GTT) performed at CT4 and CT16 in CON, CD, and CD-tRF mice (n = 7 mice per condition). *P < 0.05 denotes statistical significance for CT4 versus CT16 (paired, two-tailed Student’s t test with Holm-Sidak correction for intragroup comparison and one-way ANOVA with Tukey correction for intergroup comparison). (D) Blood glucose concentrations sampled during intraperitoneal insulin tolerance tests (ITT) and corresponding glucose AUC from 0 to 15 min performed at CT4 and CT16 in CON, CD, and CD-tRF mice (n = 6 mice per condition). *P < 0.05 denotes statistical significance for CT4 versus CT16 (paired, two-tailed Student’s t test with Holm-Sidak correction). All values represent means ± SEM.

