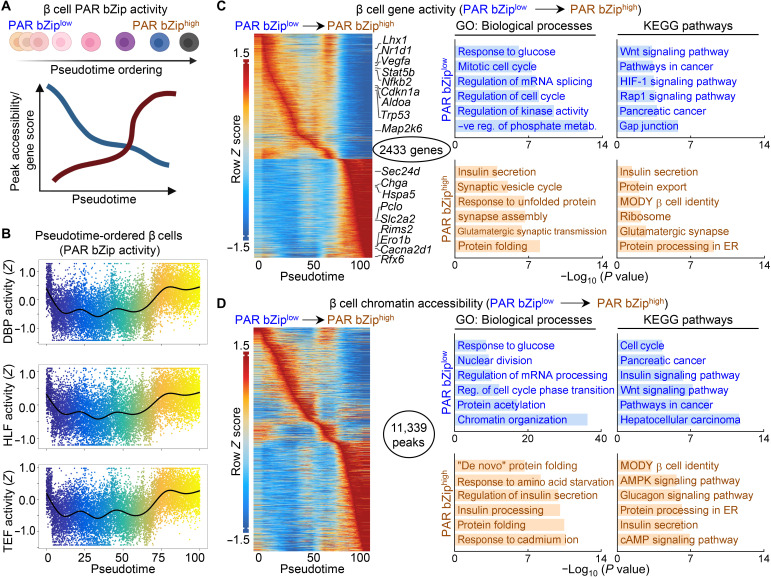
Fig. 7. Circadian PAR bZip transcription factor activation defines a subset of β cells in a state of increased insulin production and secretion.
(A) Overview of computational approach. All identified β cells by scATAC-seq were subjected to semisupervised pseudotime ordering by PAR bZip TF activity. β cells were grouped into quartiles of PAR bZip activity from low (bottom quartile) to intermediate (second and third quartile) and high (top quartile). Accessible chromatin regions and gene activation scores that varied across pseudotime were identified and annotated. (B) Trajectory analysis of PAR bZip TF (DBP, HLF, and TEF) activity along pseudotime in β cells from CON, CD, and CD-tRF mice isolated at CT4 and CT16 and subjected to scATAC-seq. (C and D) Heatmaps depicting the top 10% of gene activity scores (C) (left) and the top 5% of accessible chromatin regions (D) (left), which varied along pseudotime. Key genes controlling β cell function, identity, and stress are highlighted in (C) (left). Ontology of enriched GO: Biological Process and Kyoto Encyclopedia of Genes and Genomes (KEGG) pathways from genes (C) (right) and annotated chromatin regions (D) (right) with maximal activity/accessibility in PAR bZiplow β cells (top in blue; pseudotime, 5 to 50) or in PAR bZiphigh cells (bottom in orange; pseudotime, 70 to 100).

