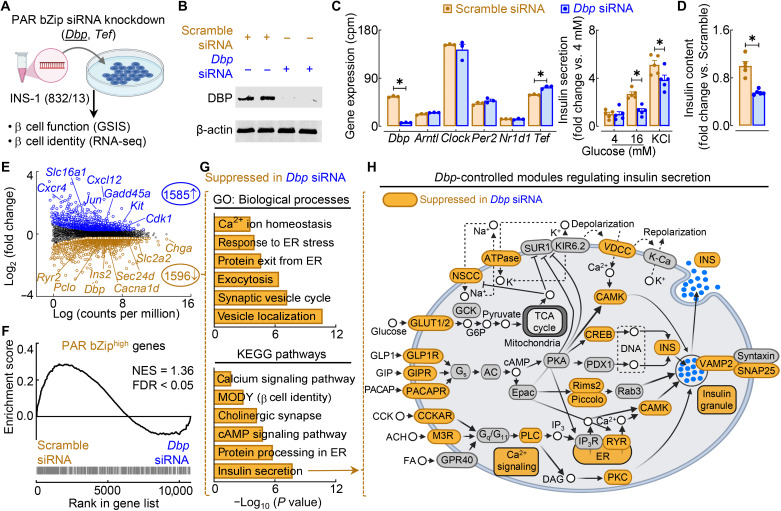
Fig. 8. PAR bZip transcription factor DBP is required for GSIS through control of key gene regulatory modules underlying the insulin secretory pathway.
(A) Overview of study design. PAR bZip TFs (Dbp and Tef) were knocked down using siRNA in INS-1 832/13 rat β cells. GSIS was assessed in each knockdown, and RNA-seq was performed in Dbp siRNA–treated β cells. (B) Representative Western blot of DBP and β-actin expression in control (20 nM scrambled siRNA) and Dbp knockdown (20 nM Dbp siRNA) β cells (n = 2 independent experiments). (C) Circadian clock gene expression in scramble siRNA– and Dbp siRNA–treated cells normalized to cpm. *FDR < 0.05 denotes statistical significance (n = 3 independent samples per group). Values represent means ± SEM. (D) GSIS (16 mM glucose) and maximal insulin secretion (30 mM KCl) of scramble siRNA– and Dbp siRNA–treated β cells normalized to basal insulin secretion (4 mM glucose; left). Total insulin content normalized to scramble control (right). *P < 0.05 denotes statistical significance (unpaired, two-tailed Student’s t test; n = 5 independent experiments per group). Values represent means ± SEM. (E) Volcano plot identifying differentially expressed genes (FC > 1.2; FDR < 0.05 by Benjamini-Hochberg method) from RNA-seq of scramble siRNA– versus Dbp siRNA–treated β cells. Key genes regulating β cell function and stress are highlighted (n = 3 independent samples per group). (F) Gene set enrichment analysis comparing gene expression in scramble siRNA– versus Dbp siRNA–treated β cells with genes active in PAR bZiphigh β cells (FDR < 0.05 by Benjamini-Hochberg method). (G) Ontology of enriched GO: Biological Process (top) and KEGG pathways (bottom) in differentially expressed genes suppressed in Dbp siRNA–treated β cells. (H) Schematic of KEGG insulin secretion pathway with gene modules significantly suppressed (FDR < 0.05, FC > 1.2) in control versus Dbp siRNA–treated cells highlighted in orange.

