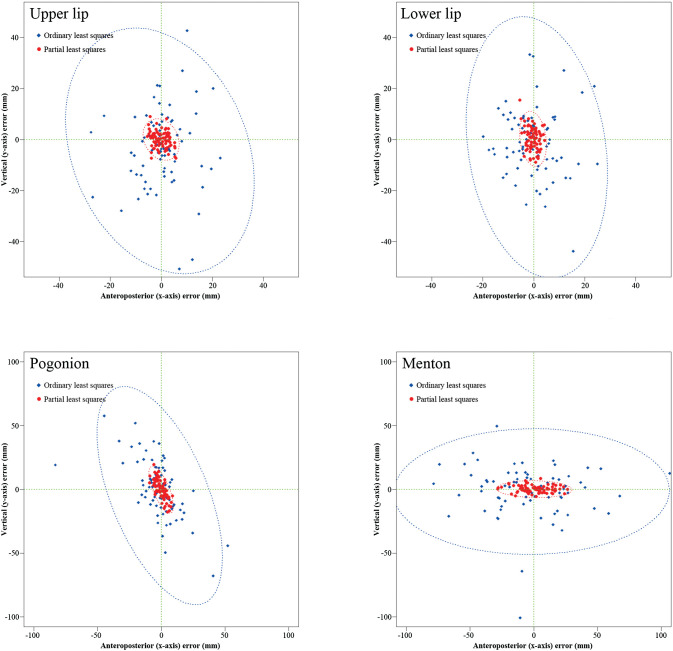
Figure 2.
Scattergrams and 95% confidence ellipses for the bias that were obtained from the OLS (blue) and PLS (red) prediction methods. The plots clearly indicate that the bias in both the x- and y-axes was greater in the OLS than in the PLS methods. Application of the equations to individuals may give rise to errors to this extent in 95% probability.

