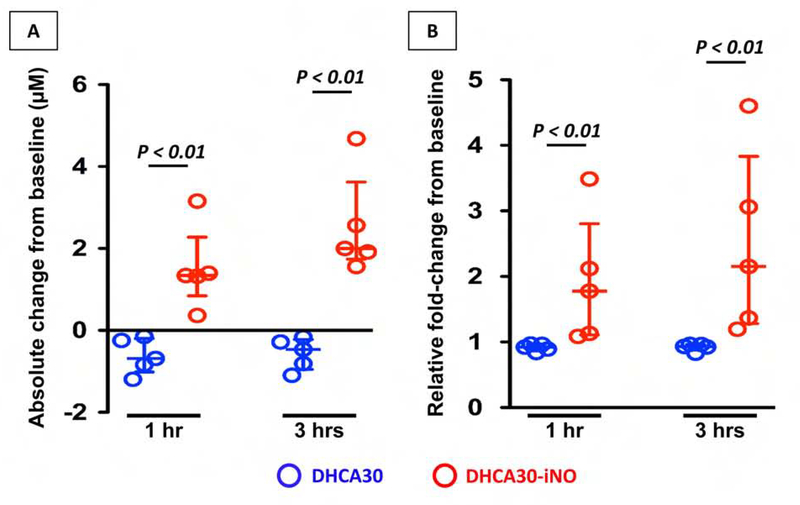
Figure 3. Plasma NOx level.
Absolute change (A) and relative fold-changes (B) from baseline (before CPB) for plasma NOx level at 1 hour and 3 hours after CPB off. Inhalation of NO after DHCA significantly increased plasma NOx level at both 1 hour and 3 hours. The upper and lower horizontal lines represent the upper and lower quartiles, and the middle horizontal line represents the median. Data are from n = 5 animals per group.

