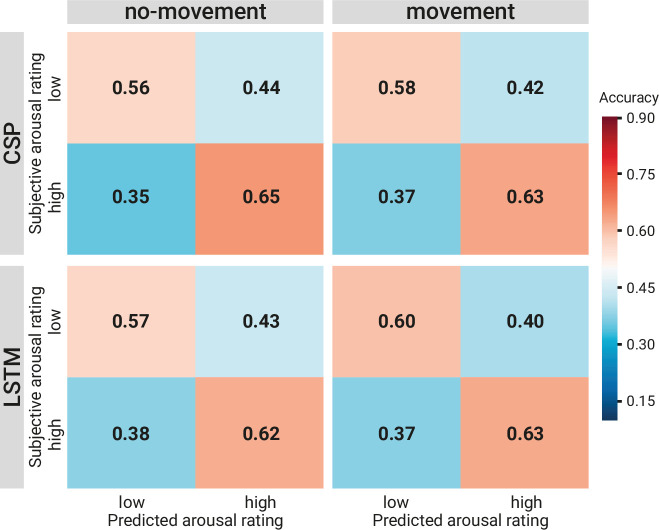
Figure 8—source data 1. Prediction tables of the binary decoding models.The zip file contains a folder for each of the movement conditions (with and without head movements) with subfolders for the binary decoding approaches (common spatial patterns [CSP], long short-term memory [LSTM]). Each folder includes three types of tables with the same format (Subjects × Samples). Subjects (N varies by condition) who went into the final classification (after removals during preprocessing). Samples (N = 270) refer to the sequential seconds of the experience (total length: 270 s). Each cell contains: targetTable: the target/ground truth assigned to this sample (by binning the continuous rating). CSP: 1=Low Arousal, 2=High Arousal, NaN = Medium Arousal; LSTM: –1=Low Arousal, 1=High Arousal, 0=Medium Arousalprediction. TableProbabilities: the probability/certainty of this sample to be classified as ‘High Arousing’ (positive probabilities) or ‘Low Arousing’ (negative probabilities). predictionTable: the binarized version of the probabilities. CSP: 1=High Arousal, 0=Low Arousal, NaN = Medium Arousal, LSTM: 1=High Arousal, –1=Low Arousal, 0=Medium Arousal.

