. 2021 Dec 1;10:e73348. doi: 10.7554/eLife.73348

Figure 1. The deletion of Mcph1 in E14 cells induces condensin II-dependent chromosome condensation in both G1 and G2 phases of the cell cycle.

(A) In gel TMR-Halo detection and western blot analysis of E14 cells wild type, Ncaph2Halo/Halo and Ncaph2Halo/Halo Mcph1Δ/Δ. TMR signal detects NCAPH2-Halo tagged. The anti-NCAPH2 antibody shows that all the NCAPH2 protein expressed is fused to the Halo-tag and that the expression levels are similar to wild type but reduced after Mcph1 deletion. The anti-SMC2 detection shows similar levels of condensin in the three cell lines. (B) Immunofluorescence analysis of Histone H3 phosphorylated on serine 10 (green) combined with TMR detection of NCAPH2-Halo (Red) in Mcph1wt/wt and Mcph1Δ/Δ cells. The DNA organisation was analysed using Hoechst. (C) EdU incorporation in Mcph1wt/wt or Mcph1Δ/Δ cells.(D) Western blot analysis of Halo-PROTAC induced NCAPH2-Halo degradation in wild-type, Ncaph2Halo/Halo Mcph1wt/wt and Ncaph2Halo/Halo Mcph1Δ/Δ cells using an anti-NCAPH2 antibody. Anti-SCC1 was used as a loading control. (E) Immunofluorescence analysis of the chromosome decompaction induced by 16 hr treatment of Mcph1Δ/Δ cells with Halo-PROTAC. Immunofluorescence analysis of Histone H3 phosphorylated on serine 10 (green) was used to compare similar cell cycle stages. All the cells showed a diffuse chromatin organisation (150 cells counted). Scale bar, 5 μm.

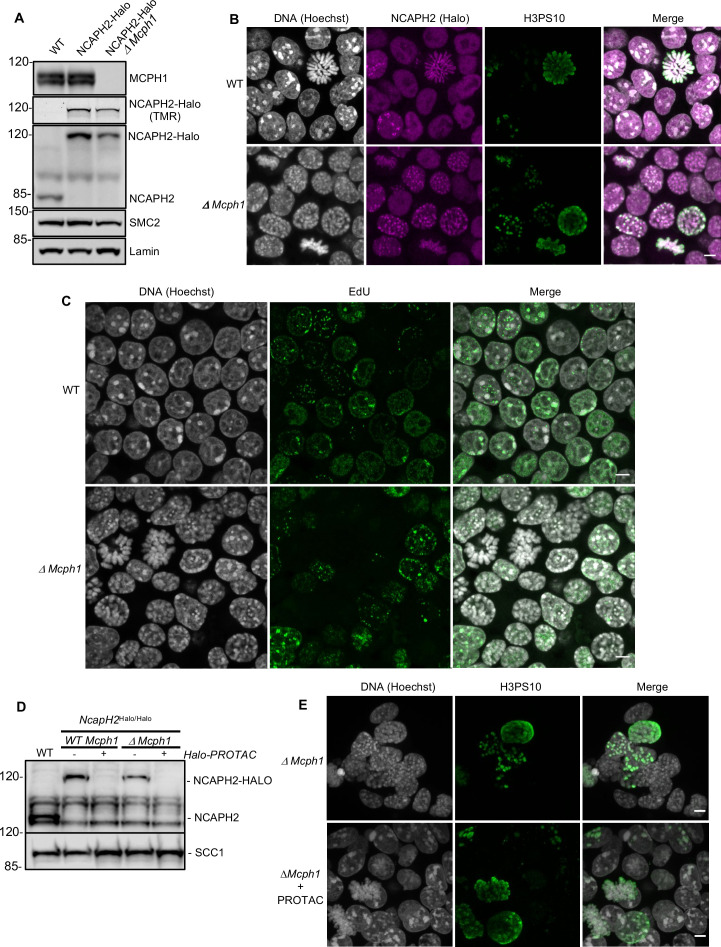
Figure 1—source data 1. Raw data uncropped blots corresponding to Figure 1A.
Figure 1—source data 2. Raw data uncropped blots corresponding to Figure 1D.

Figure 1.

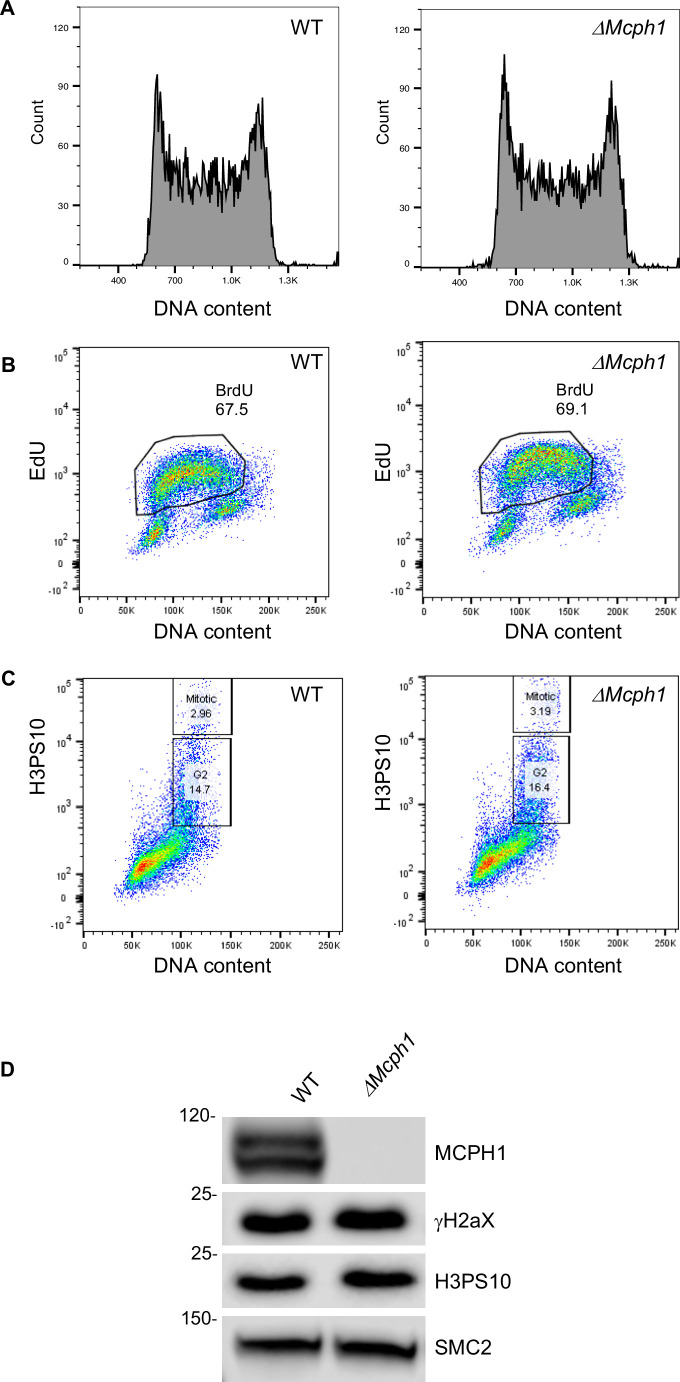
Figure 1—figure supplement 1. The cell cycle parameters are unchanged in Mcph1-deleted cells.

Figure 1—figure supplement 1.

FACS analysis of the cell cycle parameters of Mcph1 deleted cells compared to wild type: (A) Analysis of the DNA content using propidium Iodide (repeated twice). (B) EdU incorporation (repeated twice). (C) H3 Phosphorylation on serine 10 (repeated twice). All FACS experiments where repeated twice with two independent clones. (D) Western blot analysis of the amount of γH2AX and H3 phosphorylation on serine 10 in wild-type cells compared to Mcph1 deleted cells. Scale bar, 5 μm.
Figure 1—figure supplement 1—source data 1. Raw data uncropped blots corresponding to Figure 1A.
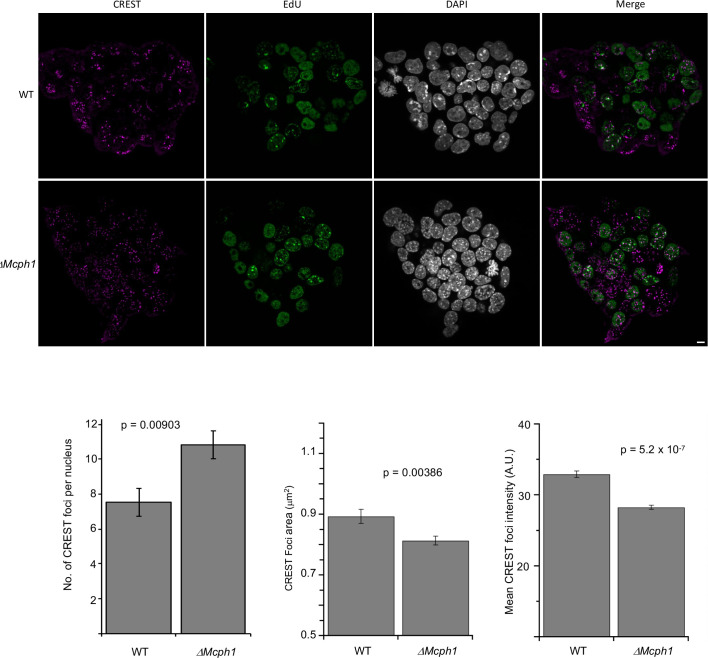
Figure 1—figure supplement 2. Chromocenters disruption in Mcph1 deleted cells.

Figure 1—figure supplement 2.

Top: Immunofluorescence analysis of centromere clustering using CREST antibody showing that in Mcph1-deleted cells, the centromeres are scattered in the nucleus even in replicating, EdU-positive cells. Bottom: Image J quantification of the number of CREST foci, their area and their intensity. The number of CREST foci was counted in 30 nuclei in each condition. The area and intensity of the foci was analysed in 369 foci for the wild-type condition and 488 foci for the Mcph1-deleted condition. In each graph, the two tailed T-test p values are indicated is indicated.
Figure 1—figure supplement 2—source data 1. Raw data of foci quantification.