. 2021 Dec 1;10:e73348. doi: 10.7554/eLife.73348

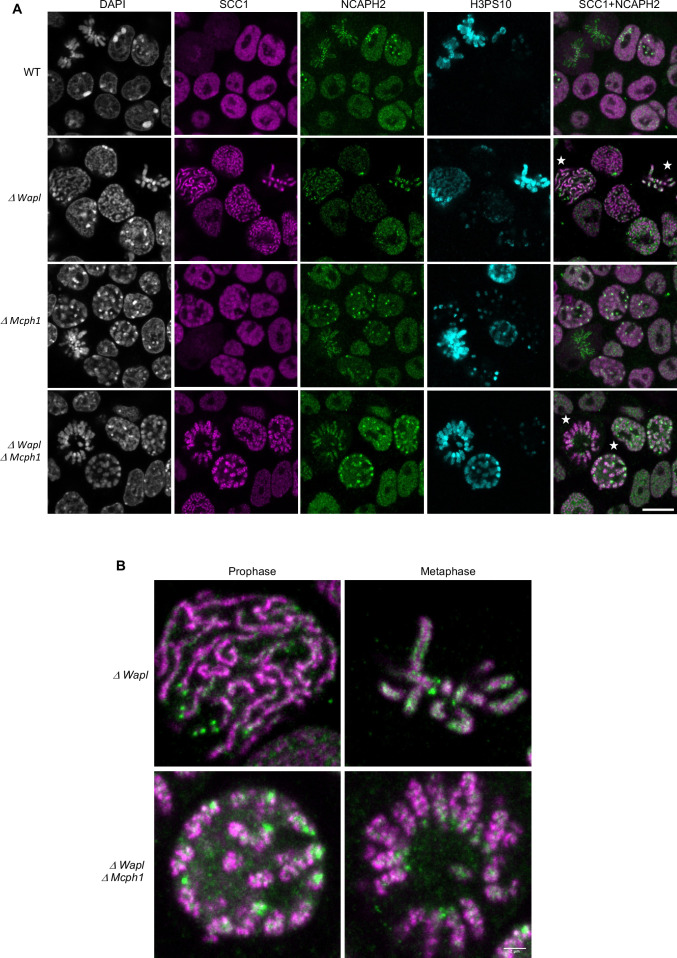
Figure 10. Mcph1 deletion induces the coiling of the vermicelli.

(A) Immunofluorescence analysis of the chromatin organisation in the four conditions: wild-type, ΔWapl, ΔMcph1, and ΔWapl ΔMcph1. In order to compare cells that are in G2, prophase or metaphase, Histone H3-serine 10 (cyan) was used as a cell cycle marker. The localisation of SCC1-Halo was analysed using Halo-JFX554, NCAPH2-GFP using nanobodies and DNA was detected using DAPI. (B) Magnified view of cells marked with a white star in panel A. Scale bar, 5 μm.

Figure 10.

Figure 10—figure supplement 1. Western blot analysis of the four conditions analysed in Figure 10 and Figure 11.
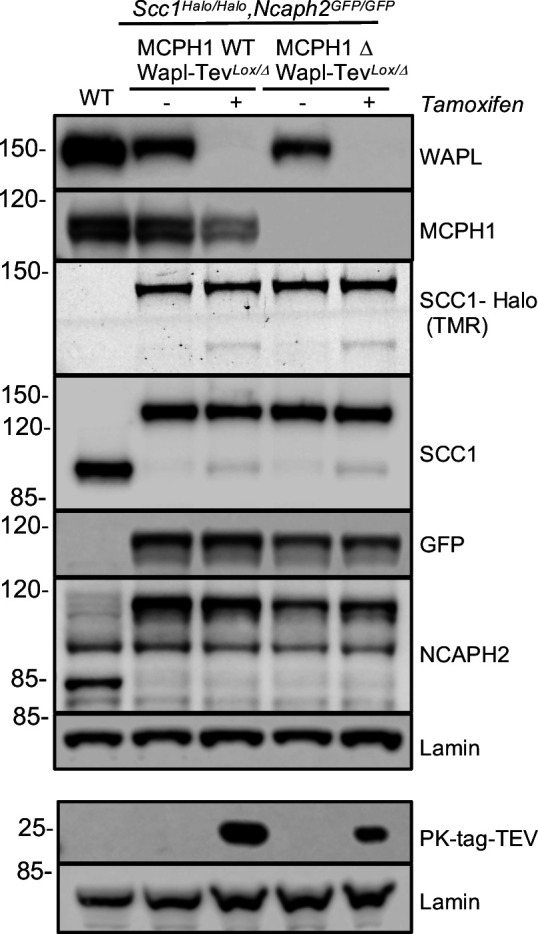
Figure 10—figure supplement 1.

The first cell line is: Ncaph2GFP/GFP Scc1Halo/Halo WaplTevLox/Δ Mcph1wt/wt. The second cell line is: Ncaph2GFP/GFP Scc1Halo/Halo WaplTevLox/Δ Mcph1Δ/Δ. Wapl can be deleted in both cell lines after Tamoxifen treatment giving four experimental conditions: Wild type, ΔWapl, ΔMcph1, and ΔWapl ΔMcph1.
Figure 10—figure supplement 1—source data 1. Raw data uncropped blots corresponding to Figure 10—figure supplement 1.
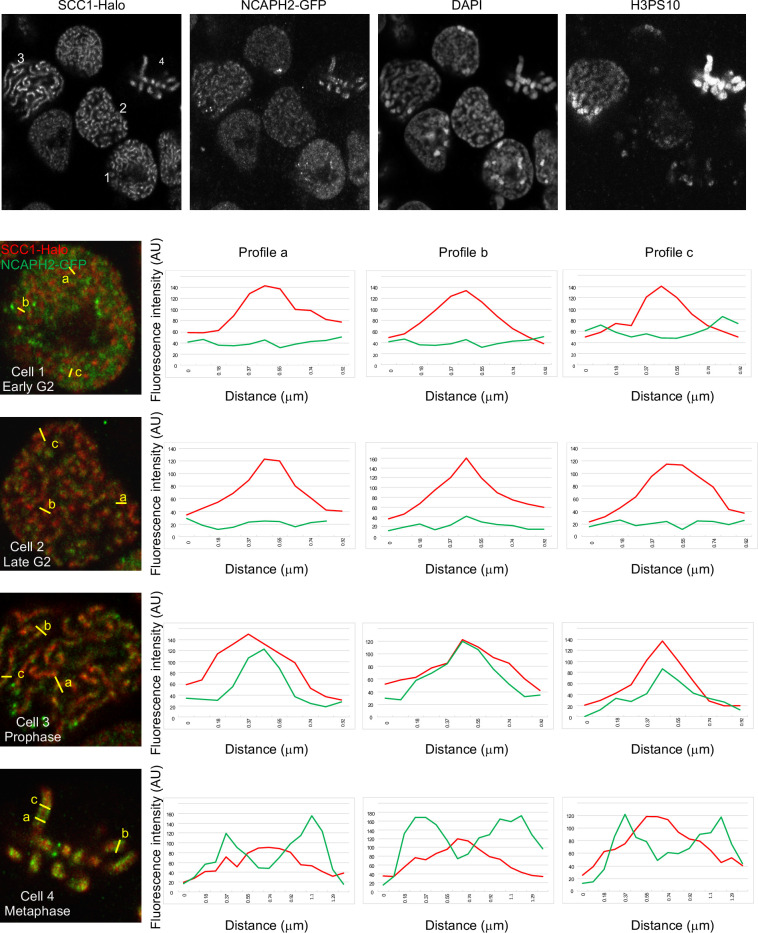
Figure 10—figure supplement 2. Quantification of NCAPH2-GFP and SCC1-Halo on the chromosome axes in ΔWapl cells.

Figure 10—figure supplement 2.

In order to address if NCAPH2-GFP was enriched on the chromosome axis of ΔWapl cells, the fluorescence of SCC1-Halo (red) and NCAPH2 GFP (green) was quantified across the axis of three different structure (a, b and c) in four representative cells in early G2 (1), late G2 (2), prophase (3), and metaphase (4) (distinguished using the H3PS10 staining). The quantifications show that NCAPH2 is enriched on the chromosome axis only in prophase and metaphase.
Figure 10—figure supplement 2—source data 1. Raw data of the fluorescence quantification.