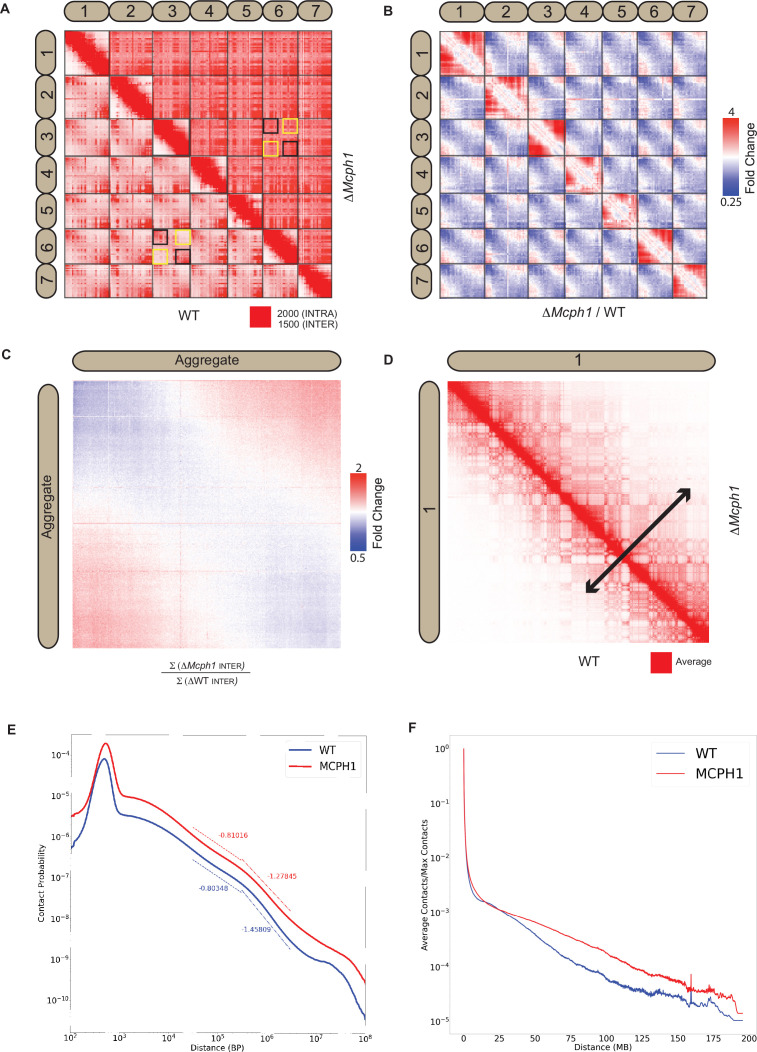
Figure 4. Mcph1 deletion causes chromosome compaction and loss of chromocenters.
(A) Representative subset of interactions between chromosomes 1–7 for wild-type and Mcph1 deletion maps (wild-type below diagonal) shows loss of chromocenters in the Mcph1 deletion maps. The intensity of color in the Hi-C maps show the frequency of contacts between pairs of loci (row and column), with the upper bound cutoff for interaction frequency in red and zero interaction frequency in white (different upper bound cutoffs for intrachromosomal vs interchromosomal interactions are indicated in the legend). In the wild-type map, the p-termini of different chromosomes show increased contact frequency with one another, as do the q-termini of different chromosomes with each other; examples of such interactions are highlighted by the black squares. The wild-type map also shows that the p-termini of one chromosome show less contact frequency with the q-termini of other chromosomes; examples of such interactions are highlighted by the yellow squares. Such differential interactions in the wild-type map are contrasted with the same regions highlighted by the black and yellow squares in the Mcph1 deletion maps, where no significant difference of interaction is seen. (B) Log fold change for Mcph1 deletion over wild-type for chromosomes 1–7. Red indicates genomic loci pairs that enriched contact in the Mcph1 deletion maps relative to wild-type, and blue indicates genomic loci pairs that have depleted contacts in the Mcph1 deletion maps relative to wild-type. (C) Log fold enrichment of the Mcph1 deletion map over wild-type map for the aggregated inter-chromosomal matrix. (D) Balanced KR-normalised Hi-C Maps for wild-type and Mcph1 deletion maps for the intrachromosomal region of chromosome 1 (wild-type below diagonal). Increased interactions between distant loci in the intrachromosomal Mcph1 deletion maps is seen. Color scale threshold is at the average value of each respective Hi-C map. Black arrows indicate the genomic distance at which loci show a greater than average level of contact frequency for the respective maps. (E) Intrachromosomal contact probability for all chromosomes shows increased long-range interactions and diminished contact drop-off for Mcph1 deletion. (F) Average intrachromosomal contact frequency for all chromosomes shows increased long-range interactions with Mcph1 deletion.


