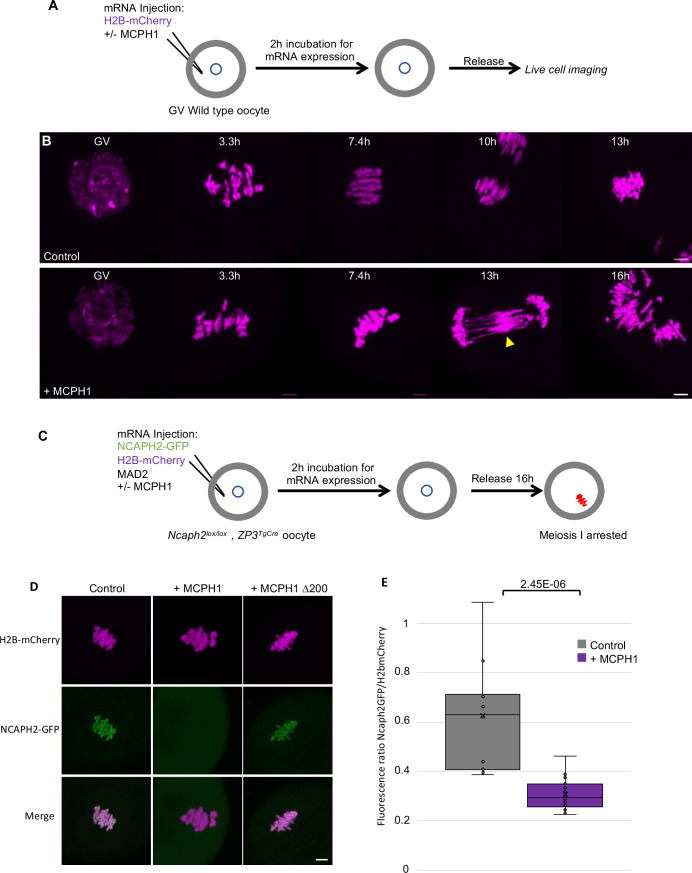
Figure 8. MCPH1 prevents the association of condensin II with chromosomes.
(A) Cartoon summarizing the experimental procedure corresponding to panel B. (B) Wild-type mouse oocytes were injected at the GV stage with in vitro transcribed mRNA coding for H2B-mCherry alone to mark the chromosomes in magenta (Control) or in combination with MCPH1 (+ MCPH1). Meiosis I progression was followed by live cell confocal imaging. The segregation defects observed in the presence of MCPH1 are indicated by a yellow arrowhead. Maximum intensity z projection images of the main time points are shown between 3.3 hr post GVBD onwards (number of oocytes analysed in three independent experiments and showing segregation defects: control:0/12;+ MCPH1: 18/19). (C) Cartoon summarizing the experimental procedure corresponding to panel D. (D) Oocytes from Ncaph2f/f Tg(Zp3Cre) females were injected at the GV stage with mRNA coding for H2B-mCherry, MAD2 and NCAPH2-GFP only (control) or in combination with MCPH1 (+ MCPH1) or MCPH1 deleted of the first N-terminal 200 amino acids (+ MCPH1 Δ200). Oocytes were arrested 16 hr after GVBD in metaphase I owing to MAD2 overexpression, and maximum-intensity z projection images of chromosomes were acquired by live cell confocal imaging (Total number of oocytes analysed in three experiments: control: 37,+ MCPH1: 58,+ MCPH1Δ200: 12). (E) Quantification of NCAPH2-GFP signal on the chromosomes. (Number of oocytes analysed in two independent experiments: control: 11;+ MCPH1: 14). In each graph the two tailed T-test p values are indicated is indicated. Scale bar, 5 μm.

