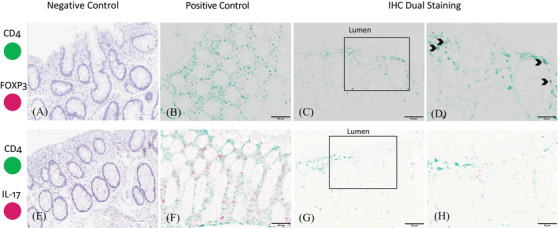
Figure 4.

Representative images of dual immunohistochemical detection of the biomarkers in rectal mucosal tissue. Tissue is from MSM engaging in CRAI. The biomarkers were CD4 (green) and FOXP3 (red; panels A–D) and CD4 (green) and IL‐17 (red; panels E–H). Black arrows (D) show the colocalization of CD4 and FOXP3 expression. Panels D and H are enlargements of the outlined boxes in panels C and G, respectively. Scale bars, 100 μm (A–C and E–G) or 50 μm (D and H).
