Figure.
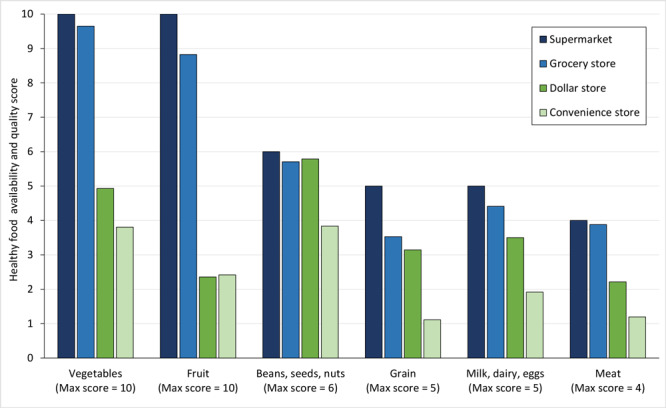
Average healthy food availability and quality score for each food group based on the Market Basket Assessment Tool in 8 counties in the Mississippi Delta region, 2019.
| Store Format | Vegetables (Max score = 10) | Fruit (Max score = 10) | Beans, seeds, nuts (Max score = 6) | Grain (Max score = 5) | Milk, dairy, eggs (Max score = 5) | Meat (Max score = 4) |
|---|---|---|---|---|---|---|
| Supermarket | 10.0 | 10.0 | 6.0 | 5.0 | 5.0 | 4.0 |
| Grocery store | 9.6 | 8.8 | 5.7 | 3.5 | 4.4 | 3.9 |
| Dollar store | 4.9 | 2.4 | 5.8 | 3.1 | 3.5 | 2.2 |
| Convenience store | 3.8 | 2.4 | 3.8 | 1.1 | 1.9 | 1.2 |

