
FIGURE 2.
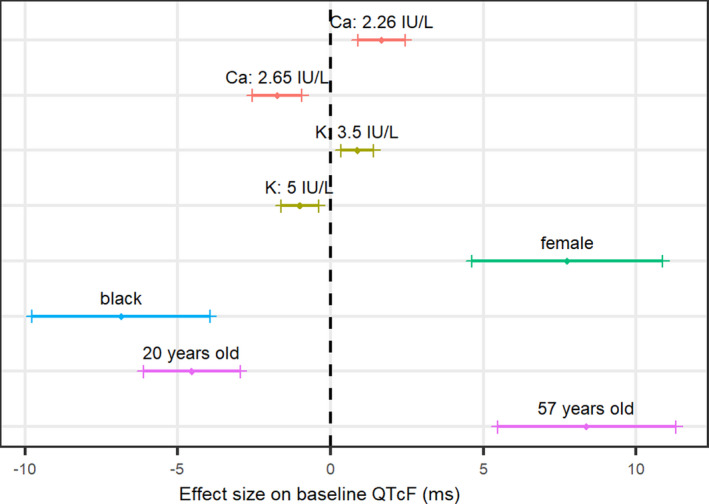
Illustration of the direction and size of each covariate effect on baseline QTcF interval (QTcF0). Continuous covariates are displayed as the 5th and 95th percentiles of the covariate range. Categorical covariates are compared with the other category. The bands show the 90% confidence interval around the point estimate. The vertical dashed line represents the typical individual: a 33‐year‐old non‐Black male subject with a potassium (K) level of 4.2 IU/L and a calcium (Ca) level of 2.45 IU/L