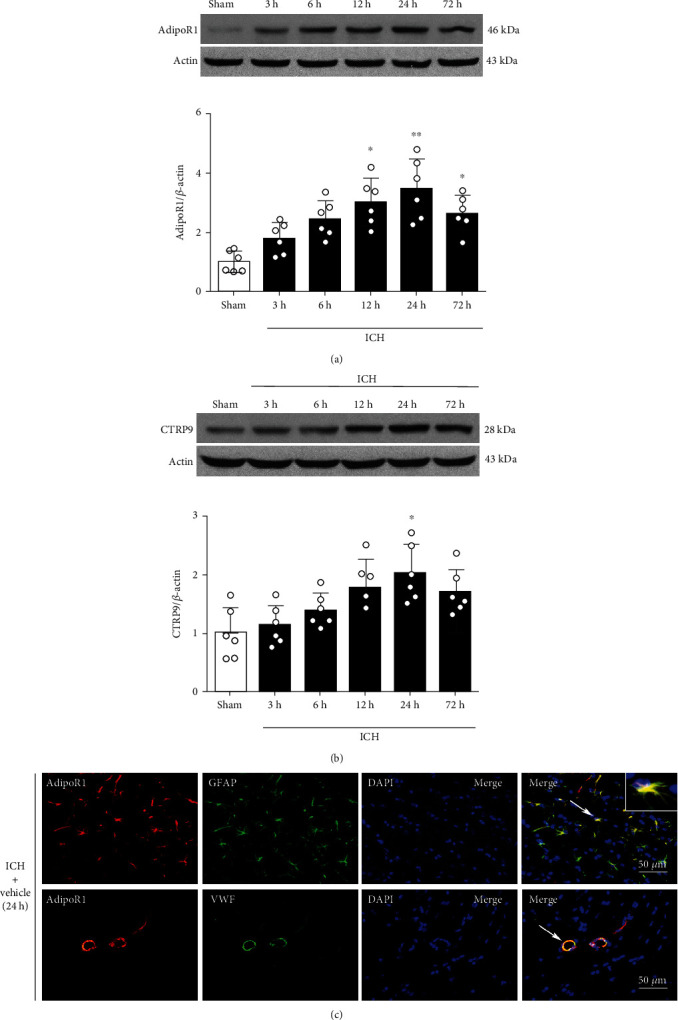
Figure 1.

The endogenous expression of AdipoR1 and CTRP9 after ICH. (a) Representative time-dependent WB bands and density quantification of AdipoR1. (b) Representative time-dependent WB bands and density quantification of CTRP9. ∗p < 0.05 and ∗∗p < 0.01 vs. sham. (c) Double immunofluorescence staining of AdipoR1 (red) with astrocytes (green, GFAP) and vascular endothelial cells (green, VWF) in the right basal cortex at 24 h post-ICH. Nuclei were stained with DAPI (blue). GFAP: glial fibrillary acidic protein; DAPI: 4′,6-diamidino-2-phenylindole; VWF: von Willebrand factor.
