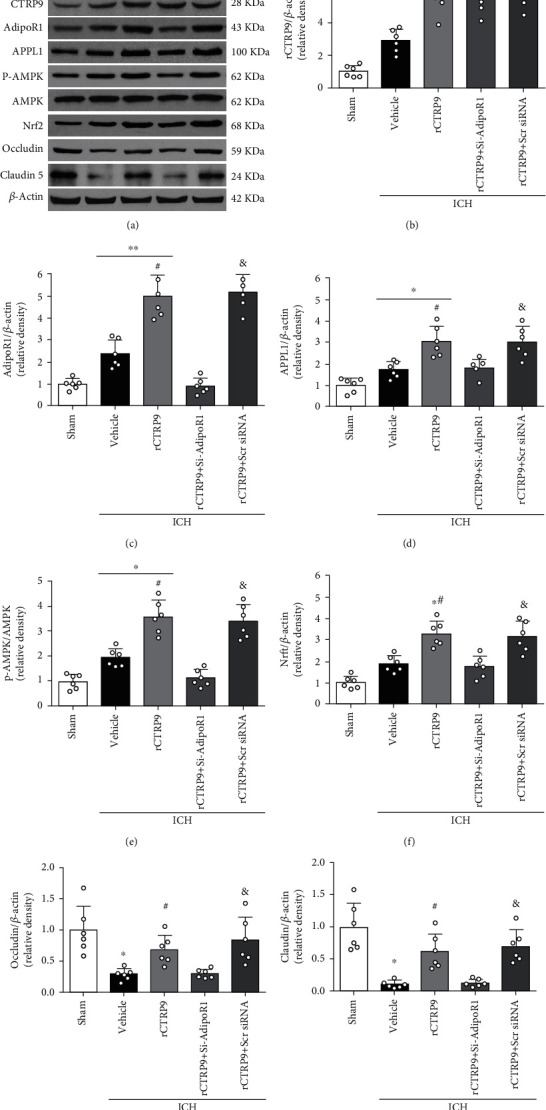
Figure 4.

Effects of knockdown of AdipoR1 on the expression of signal molecules of AdipoR1, APPL1, p-AMPK, Nrf2, occludin, and claudin 5 after ICH. (a) Representative photographs in western blotting. (b–h) Quantitative analysis of CTRP9, AdipoR1, APPL1, p-AMPK, Nrf2, occludin, and claudin 5, respectively. ∗p < 0.05 vs. sham, ∗∗p < 0.01 vs. sham, #p < 0.05 vs. vehicle, and &p < 0.05 vs. rCTRP9+siRNA.
