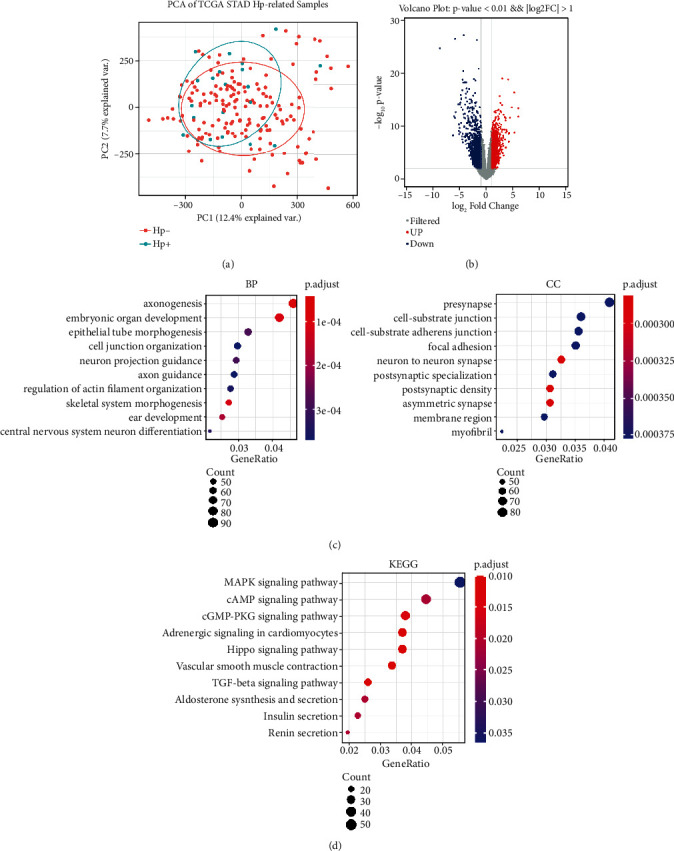
Figure 2.

Identification of DMGs and enrichment analysis of the DMGs. (a) PCA of H. pylori-positive GC and H. pylori-negative GC samples. (b) Volcano map of methylation results in 188 GC samples. Red represents hypermethylation, and blue represents hypomethylation. (c) Top 10 genes from the GO analysis of 2454 DMGs. BP: biological process; CC: cellular component. (d) Top 10 genes from the KEGG analysis. KEGG: Kyoto Encyclopedia of Genes and Genomes.
