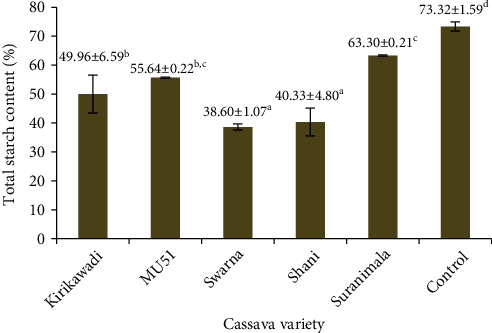
Figure 4.

Starch contents of cassava flours from five Sri Lankan cassava varieties. Values are expressed as mean ± standard deviation of three independent determinations. Different superscripts represent significantly different samples (p < 0.05). Commercial wheat flour was used as the control.
