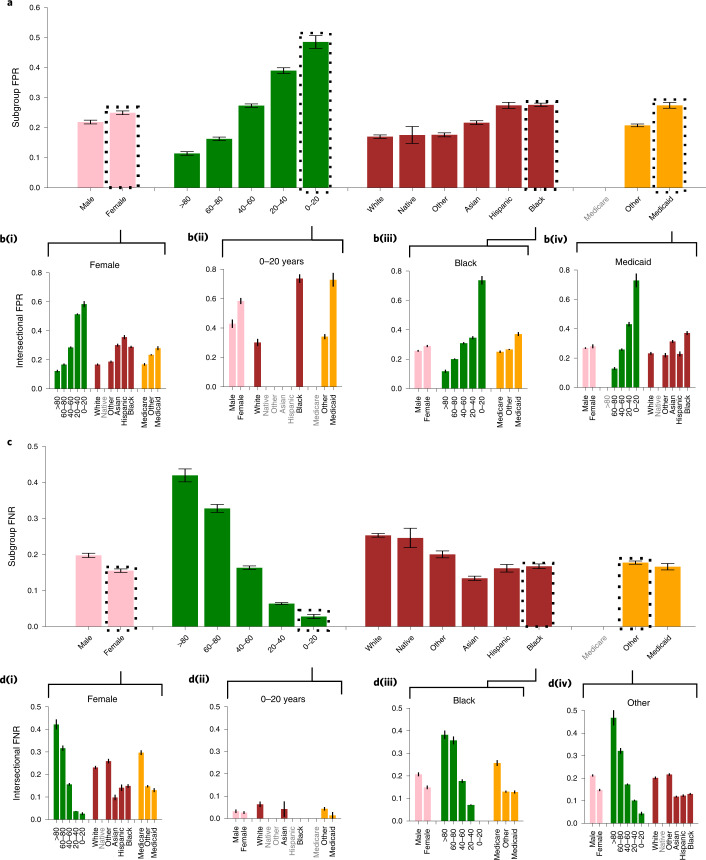
Fig. 2. Analysis of underdiagnosis across subgroups of sex, age, race/ethnicity and insurance type in the MIMIC-CXR (CXR) dataset.
a, The underdiagnosis rate, as measured by the no finding FPR, in the indicated patient subpopulations. b, Intersectional underdiagnosis rates for female patients (b(i)), patients aged 0–20 years (b(ii)), Black patients (b(iii)), and patients with Medicaid (b(iv)). c,d, The overdiagnosis rate, as measured by the no finding FNR in the same patient subpopulations as in a and b. The results are averaged over five trained models with different random seeds on the same train–validation–test splits. 95% confidence intervals are shown. Subgroups with too few members to be studied reliably (≤15) are labeled in gray text and the results for these subgroups are omitted. Data for the Medicare subgroup are also omitted, given that data for this subgroup are highly confounded by patient age.

