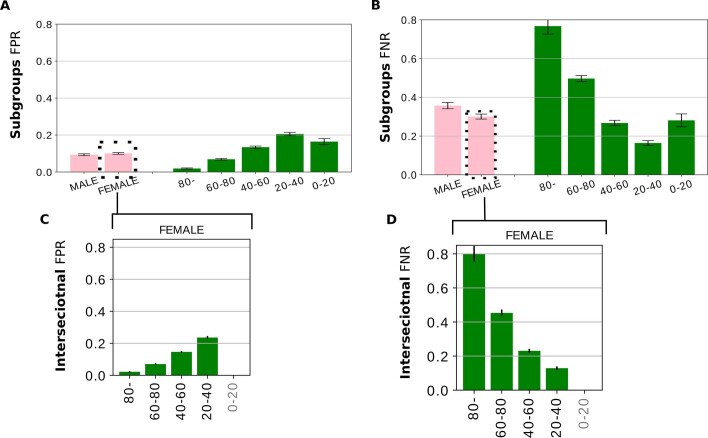
Extended Data Fig. 2. Analyzing underdiagnoses over subgroups of sex, age, within CheXpert (CXP) dataset.
Fig. S2. Analyzing underdiagnoses over subgroups of sex, age, within CheXpert (CXP) dataset. The results are averaged over 5 trained model with different random seed ± 95% CI. A. The underdiagnosis rate is FPR in ‘No Finding’. B. Examining the overdiagnosis rate (‘No Finding’ FNR) over sex and age subgroups, C. The intersectional underdiagnosis rates within only female patients, and D. measure the overdiagnosis rate for the intersectional identities. The subgroups labeled in gray text, with results omitted, indicate the subgroup has too few members (<= 15) to be used reliably. The number of images with actual 0 or 1 ‘No Finding’ label in the age - sex intersections in the test dataset is presented in Supplementary Table 1.

