
Fig. 1. SARS-CoV-2 surveillance sequencing in England between September 2020 and June 2021.
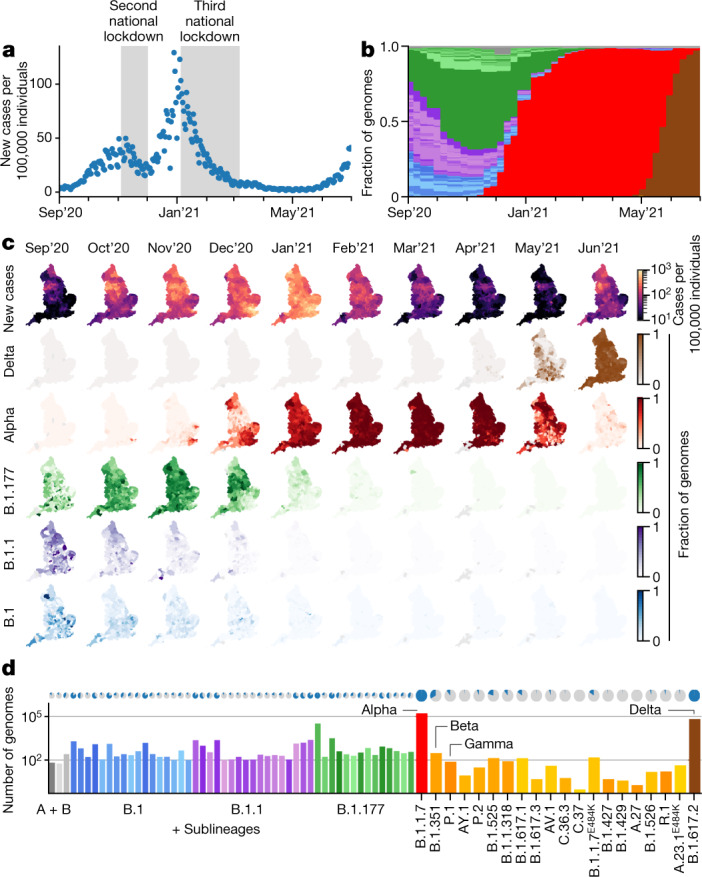
a, Positive Pillar 2 SARS-CoV-2 tests in England. b, The relative frequency of 328 different PANGO lineages, representing approximately 7.2% of the tests shown in a. c, Positive tests (row 1) and the frequency of 4 major lineages (rows 2–5) across 315 English lower tier local authorities. d, The absolute frequency of sequenced genomes mapped to 71 PANGO lineages. The blue areas in the pie charts are proportional to the fraction of LTLAs in which a given lineage was observed.