
Fig. 2. Spatiotemporal model of 71 SARS-CoV-2 lineages in 315 English LTLAs between September 2020 and June 2021.
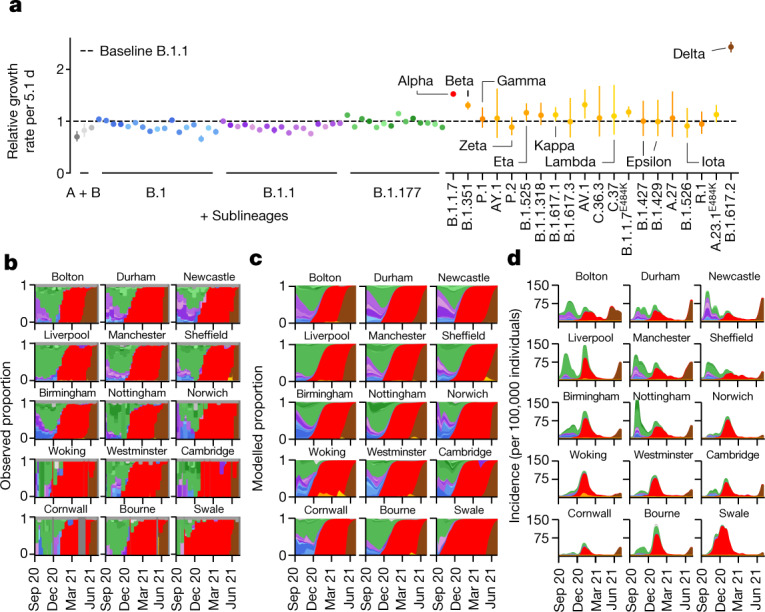
a, The average growth rates for 71 lineages. Data are median ± 95% CI. b, Lineage-specific relative frequency for 35 selected LTLAs, arranged by longitude and latitude to geographically cover England. c, Fitted lineage-specific relative frequency for the same LTLAs as in b. d, Fitted lineage-specific incidence for the same LTLAs as in b.