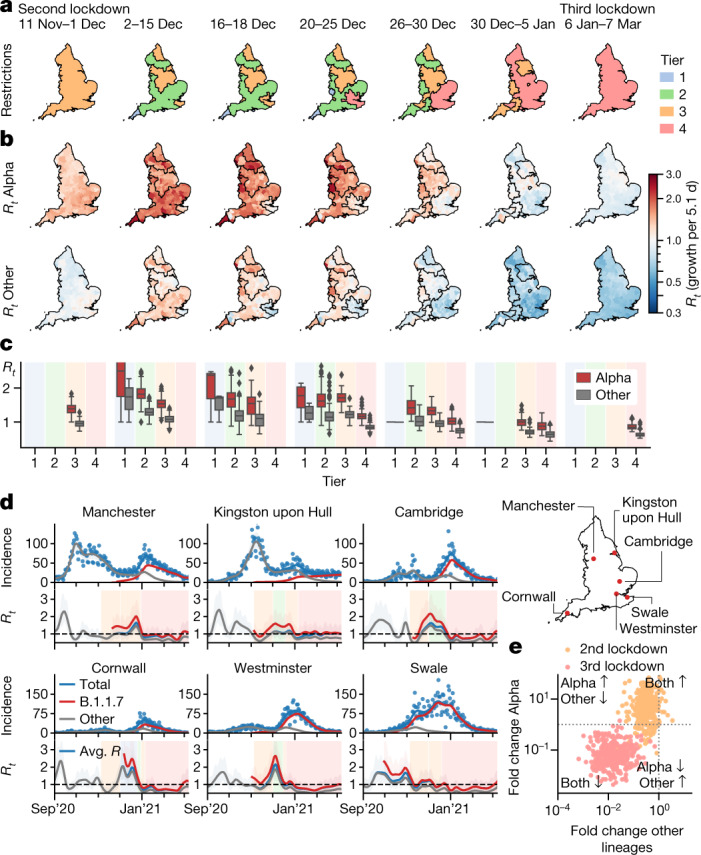
Fig. 3. Growth of B.1.1.7/Alpha and other lineages in relation to lockdown restrictions between November 2020 and March 2021.

a, Maps and dates of national and regional restrictions in England. Second national lockdown: closed hospitality businesses; contacts ≤ 2, outdoors only; open schools; reasonable excuse needed for leaving home45. Tier 1: private indoor gatherings of ≤6 persons. Tier 2: as tier 1 plus restricted hospitality services; gatherings of ≤6 in public outdoor places. Tier 3: as tier 2 plus most hospitality businesses closed. Tier 4: as tier 3 but single outdoor contact. Third national lockdown: closed schools with the exception of key workers. b, Local lineage-specific Rt values for Alpha and the average Rt value (growth per 5.1 d) of all of the other lineages in the same periods. c, Rt values from n = 315 LTLA shown in b. The box centre horizontal line indicates the median, box limits show the quartiles, the whiskers extend to 1.5× the interquartile range. d, Total and lineage-specific incidence (top) and Rt values (bottom) for six selected LTLAs during the period of restrictions. e, Crude lineage-specific fold changes (odds ratios) in Alpha and other lineages across the second (orange) and third national lockdown (red).
