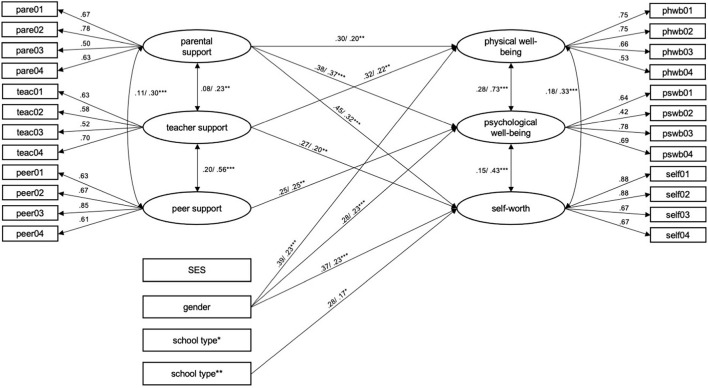
FIGURE 1.
Structural equation model for regression analysis, including control variables. Gender: female = 0, male = 1, school type* = contrasts students from low-track and high-track schools with students from mixed-track schools; school type** = contrasts students from low-track and mixed track school with students from high-track schools; coefficients are displayed unstandardized first, and standardized in second position; only significant paths are shown for clarity; *p < 0.05, **p < 0.01, ***p < 0.001.

