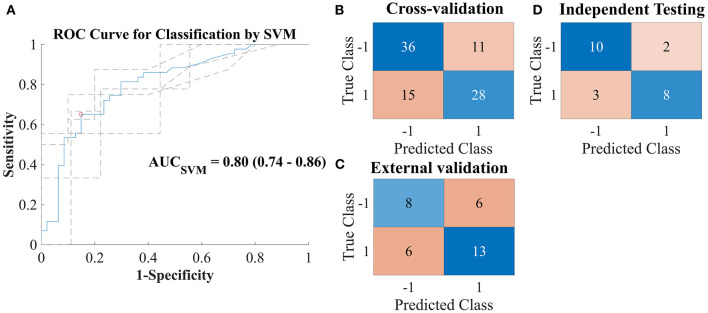
Figure 4.
(A) Receiver operating characteristic curve for prediction of group classification—complete recovery (CR; class label: 1) vs. incomplete recovery (IR; class label: −1)—based on a linear support vector machine (SVM) model built with the optimal subselection of discriminating features and 5-fold cross-validation. Dashed lines indicate results per fold. (B–D) Confusion matrices for the predictions of the SVM model vs. true labels on cross-validation dataset [(B); 80% of the UPFRONT dataset], external validation on unseen data [(C); 20% of the UPFRONT dataset], and testing on an independent dataset [(D); ReCONNECT dataset].

