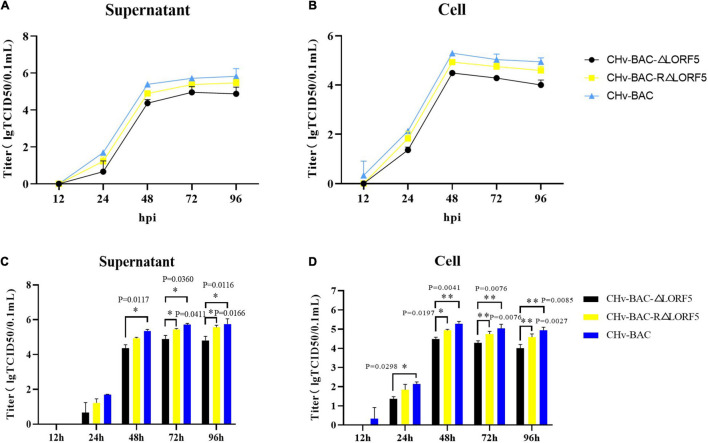
FIGURE 3.
Determination of viral titers in growth kinetics of CHv-BAC-ΔLORF5, CHv-BAC-RΔLORF5, and CHv-BAC. DEF cells in 12-well plates were infected with CHv-BAC, CHv-BAC-RΔLORF5, and CHv-BAC-ΔLORF5 (MOI = 0.01). Samples were collected at the indicated time points, and viral titers were determined. The data were presented as the mean ± standard deviation (SD, P > 0.05) of three independent experiments. (A) Supernatant viral titers. (B) Cell viral titers. (C) Statistical analysis of the difference of virus titer in the supernatant at each time point. (D) Statistical analysis of the difference of virus titer in the cell at each time point. Asterisks indicate significant differences compared to WT virus (∗∗P < 0.01; ∗P < 0.05).

