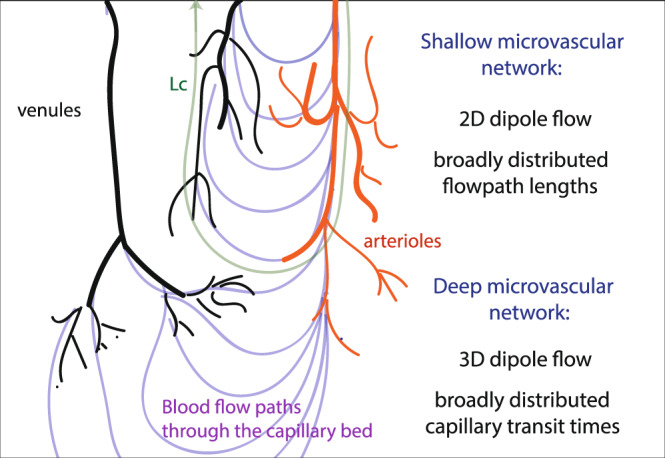
Fig. 3. Schematic illustration of the blood flow organization in the cortical microcirculation inferred from the observed flow and transport properties.

Arterioles and venules are represented in red and black respectively. Blood flow paths through the capillary bed are represented as light purple lines. The characteristic trajectory length Lc is the maximum length of trajectories that can travel directly from one arteriole to a neighboring venule (green line).
