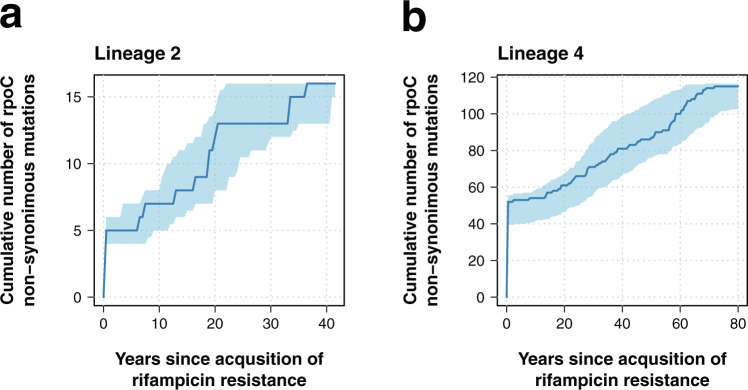
Fig. 3. Dynamics of non-synonymous mutations in rpoC.
a, b Cumulative number of non-synonymous mutations in rpoC over time. The x-axis represents the years since the inferred time of rifampcin resistance (time 0). Dark blue line shows the cumulative number of mutations for the ML tree, while the 95% confidence interval (shaded area) is inferred by repeating the analysis in 100 bootstrap phylogenies. The analysis was performed separately for a lineage 2 and b lineage 4.

