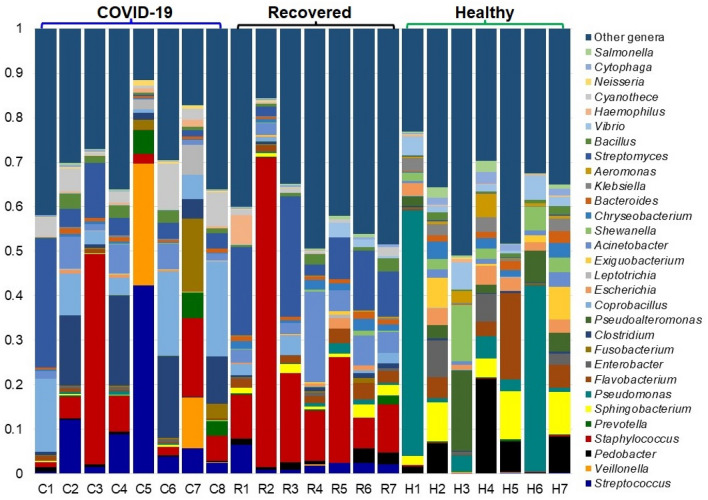
Figure 4.
The genus-level taxonomic profile of bacteria in COVID-19 (C1–C8), Recovered (R1–R7) and Healthy (H1–H7) nasopharyngeal samples. The relative abundance of 30 most abundant bacterial genera are sorted from bottom to top by their deceasing proportion, with the remaining genera keeping as ‘Other genera’. Each stacked bar plot represents the abundance of bacterial genera in each sample of the corresponding category. Notable differences in bacterial populations are those where the taxon is abundant in COVID-19 and Recovered samples, and effectively undetected in the Healthy controls. The distribution and relative abundance of the bacterial genera in the study metagenomes are also available in Data S1. The bar plot is generated using Microsoft Excel program.

