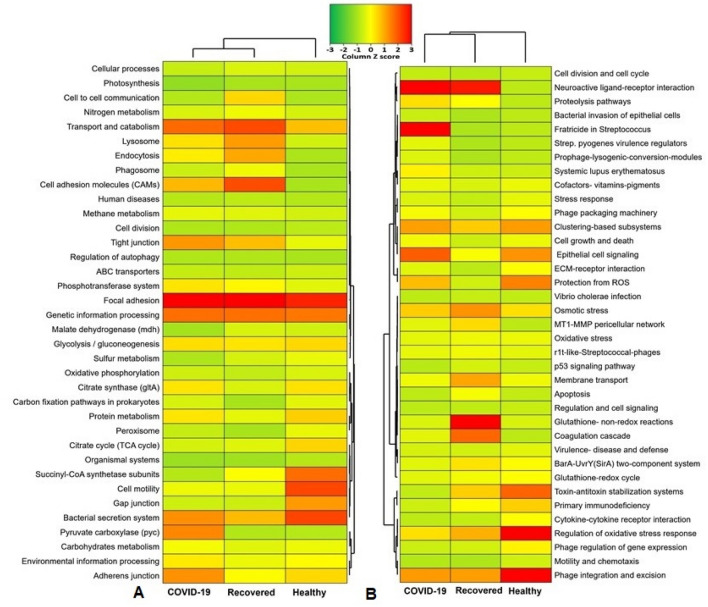
Figure 9.
Functional annotation of the COVID-19, Recovered and Healthy nasopharyngeal sample related sequences. (A) Heatmap representing the average relative abundance hierarchical clustering of the predicted KEGG Orthologs (KOs) functional pathways of the microbiome across four metagenome groups. (B) Heatmap showing the average relative abundance hierarchical clustering of the predicted SEED functions in different levels among the microbiomes of four metagenomes. The color bars (column Z score) at the top represent the relative abundance of putative genes. The color codes indicate the presence and completeness of each KEGG and SEED module, expressed as a value between − 3 (lowest abundance) and 3 (highest abundance). The red color indicates the more abundant patterns, whilst green cells account for less abundant putative genes in that particular metagenome. The Heatmap is built through a stand-alone software tool called FunRich (http://www.funrich.org/).

