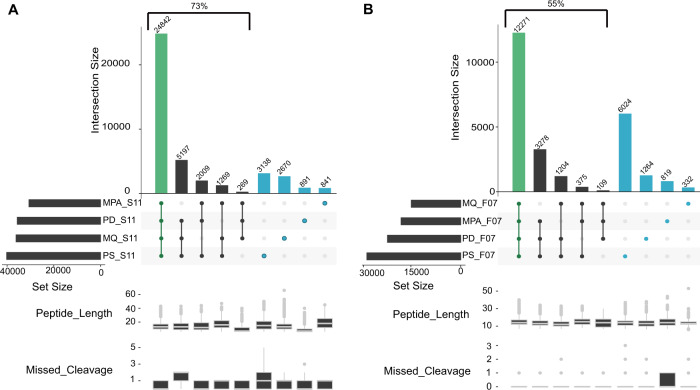
Fig. 3. UpSet plot comparison of identified sets of peptides using different bioinformatic pipelines.
The left panel displays the results for the SIHUMIx sample S11 (A), while the right panel corresponds to the results for the fecal sample F07 (B). The four different bioinformatic pipelines (MetaProteomeAnalyzer (MPA, using X!Tandem and OMSSA), Proteome Discoverer (PD, using SequestHT), MaxQuant (MQ, using Andromeda), SearchGUI/PeptideShaker (PS, using X!Tandem, OMSSA, MS-GF+, and Comet)) are indicated on the x-axis and sorted by increasing set size. Set size corresponds to the total number of peptides identified per tool, and intersection size corresponds to the number of shared peptides identified in different approaches. Green highlights the intersection, and blue shows unique peptides to each tool. The lower panel box plots show peptide lengths, and number of missed cleavages for each intersection. Source data is provided as a Source Data file.

