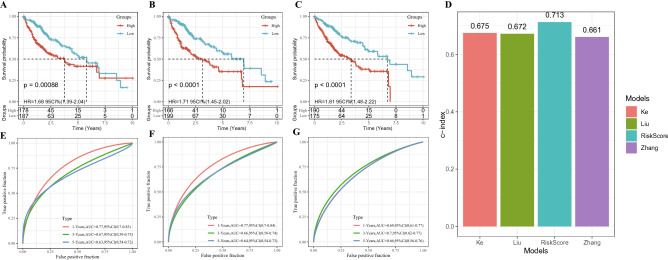
Figure 12.
Assessment of the risk models in predicting prognosis of HCC. (A) The survival of samples in TCGA-LIHC was analyzed by six-gene signature (including CSE1L, CSTB, MTHFR, DAGLA, MMP10, and GYS2). (B) The Kaplan–Meier curve of sample survival in TCGA-LIHC was predicted by a risk model consisting of CA9, CXCL5, MMP12, SLC1A5 and G6PD. (C) The Kaplan–Meier curve of sample survival in TCGA-LIHC was predicted by a risk model composed of SPINK1, TXNRD1, LCAT and PZP. (D) C index of our risk model and the other three risk models. (E) ROC curve of six-gene signature for predicting HCC prognosis. (F) ROC curve for predicting HCC prognosis by risk model composed of CA9, CXCL5, MMP12, SLC1A5 and G6PD. (G) ROC curve of the model consisting of SPINK1, TXNRD1, LCAT and PZP to predict HCC survival.

