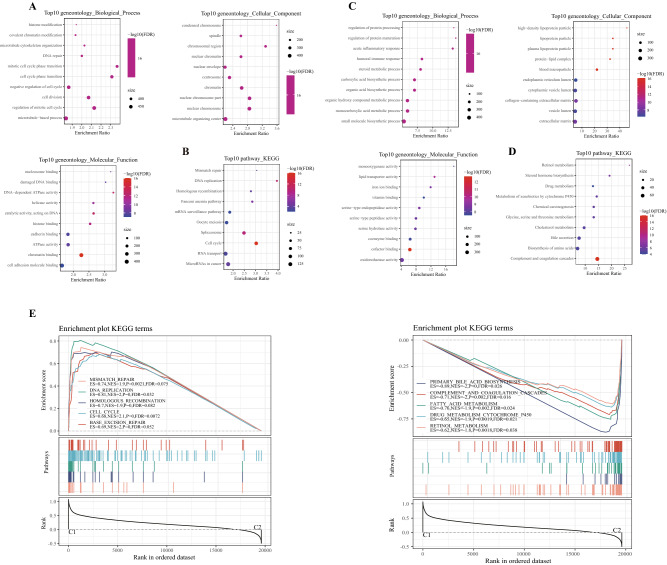
Figure 5.
The pathway enrichment analysis of DEGS and subtypes. (A) Go functional annotation of differentially upregulated genes, including top 10 biological process (BP), top10 cellular component (CC) and top 10 molecular function (MF). (B) KEGG annotation of differentially upregulated genes. (C) GO functional annotation of differentially down-regulated genes. (D) KEGG annotation results of differentially regulated genes. E: GSEA analysis of main enriched pathways in the C1(left) and C2(right).

