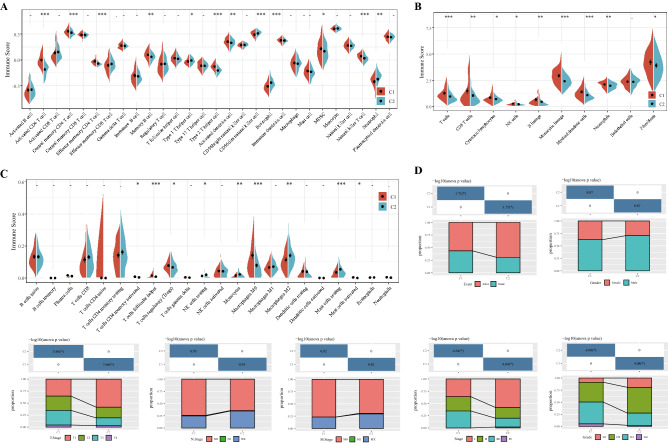
Figure 6.
Relationship between molecular subtypes and immune infiltration and clinical features. (A) Immune scores of 28 immune cells in C1 and C2 subtypes were analyzed by ssGSEA. (B) MCP Counter calculated the immune scores of 10 types of immune cells between two clusters. (C) Immune scores of 22 infiltrative immune cell components in C1 and C1 subtypes of tumors. (D) Event, gender, T stage, N stage, M stage, AJCC stage and grade distribution of each subtype in the TCGA cohort.

