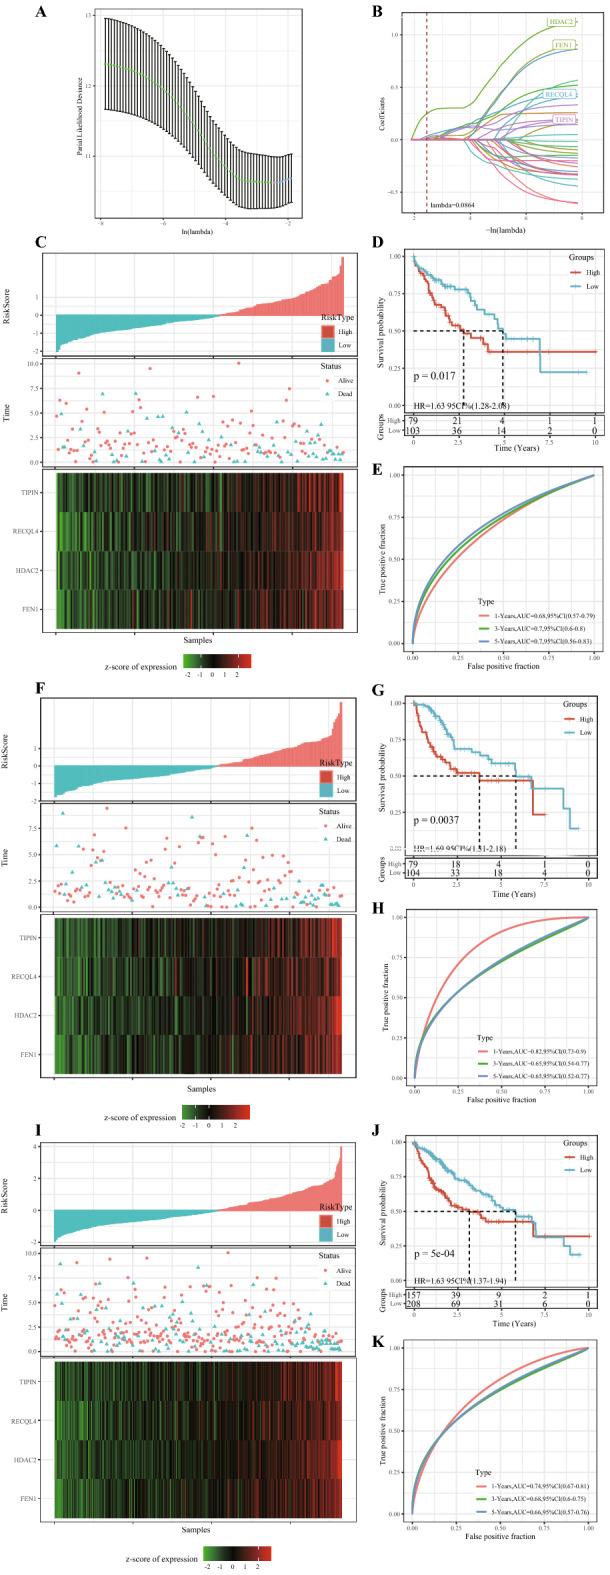
Figure 7.

Risk models were constructed based on prognosis-related HRD genes. (A) Screening of optimal lambda. (B) LASSO coefficient spectra of 33 HCC prognostic genes. (C) The risk scores of the TCGA training cohort were arranged in order from low to high, the existential state of the patients and the expression heat maps of the four genes. (D) Kaplan–Meier survival analysis uncovered differences in OS between high-risk and low-risk patients in the TCGA training cohort. (E) ROC curves of 1-year, 3-year, and 5-year OS of TCGA training cohort samples. (F) In the TCGA validation cohort, the risk scores of the cases were arranged in order from low to high, the existential state of the cases and the expression heat maps of the four genes. (G) Kaplan–Meier survival analysis revealed differences in OS between high-risk and low-risk patients in the TCGA validation cohort. (H) 1-year, 3-year, and 5-year OS curves for patients in the TCGA validated cohort. (I) Risk score arrangement, survival state and heat map of expression of 4 genes for samples in the entire TCGA dataset. (J) Survival curves of patients at different risk across the TCGA dataset. (K) ROC curves of 1-year, 3-year and 5-year OS samples in the entire TCGA dataset.
