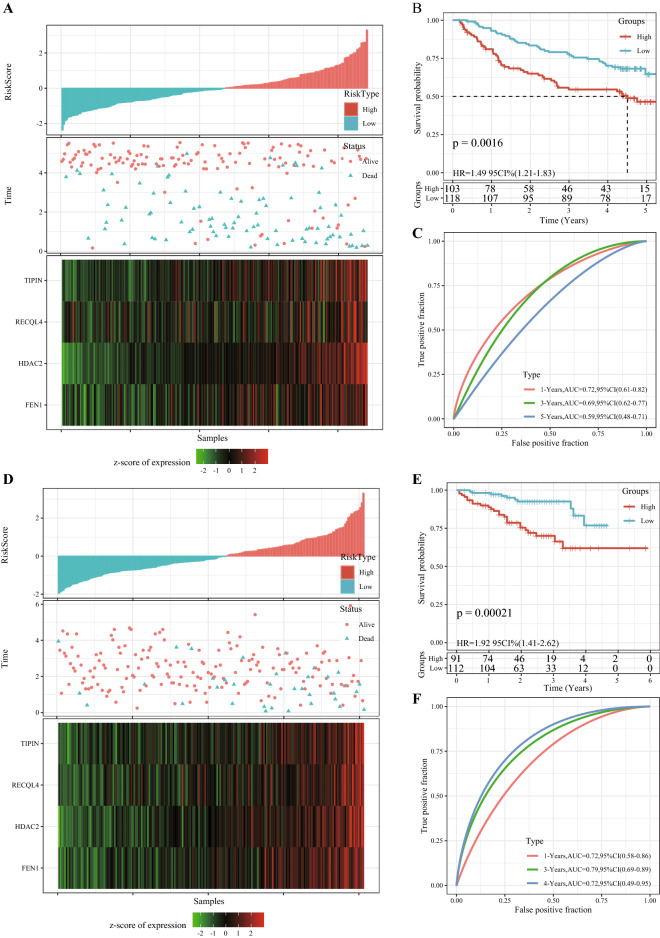
Figure 8.
The prognostic model was validated in separate cohorts. (A) Risk score distribution, existential state, and 4 gene expression heat maps of HCC cases in the GSE14520 cohort. (B) The survival analysis of patients in different risk groups in the GSE14520 validated cohort. (C) 1-year, 3-year, and 5-year ROC curves in the GSE14520 cohort based on the 4-gene scoring model. (D) Risk score distribution, existential state and heat map of 4 genes in HCC patients in the HCCDB18 dataset. (E) The 4-gene scoring model was used to evaluate the OS of the samples in the HCCDB18 dataset. (F) 1-year, 3-year, and 5-year ROC curves for HCC patients in the HCCDB18 data sets.

