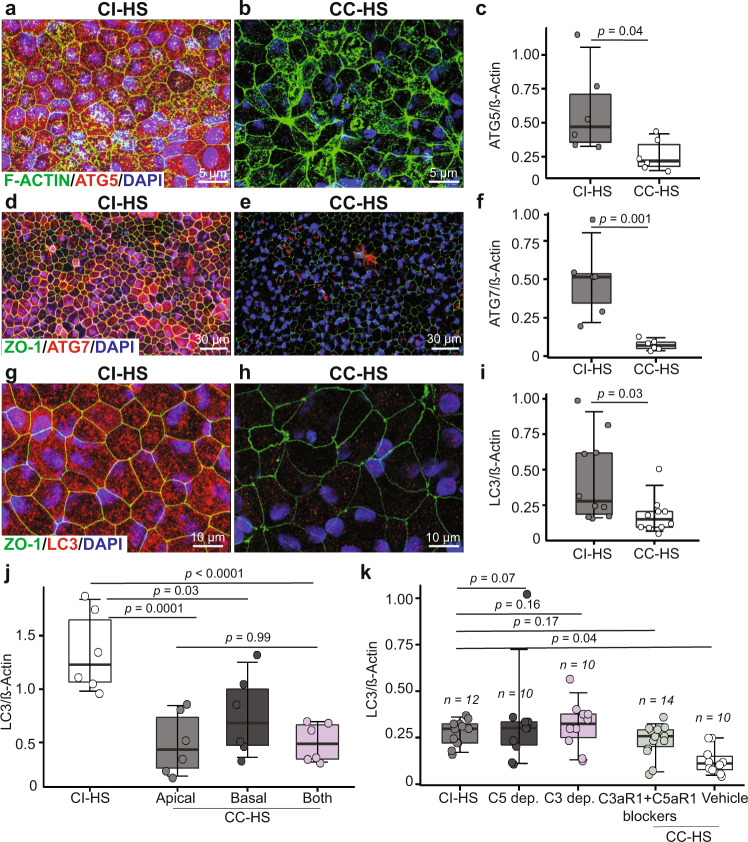
Fig. 5. Anaphylatoxin signaling downregulates autophagy in CFH(Y/Y)-iRPE and CFH(H/H)-iRPE iRPE cells.
a–i Autophagy pathway proteins, ATG5 (red, a, b), ATG7 (red, d, e) and LC3 (red, g, h), are downregulated in CC-HS-treated CFH(Y/Y)-iRPE2, compared to CI-HS treatment; as confirmed by immunostaining (a–h, F-ACTIN—green), and quantification of western blots for ATG5 (c), ATG7 (f) and LC3-II (i) (N = 3 biologically independent replicates and two technical replicates, iRPE1, 4, 8 for (a–h); N = 5 biologically independent replicates and two technical replicates, iRPE1, 4, 7, 8, 10 for (i)). P values were determined by pairwise comparisons using two-tailed t test with 95% confidence interval and Bonferroni correction. The horizontal lines in the boxplots indicate the median, the boxes indicate the first and third quartiles, and the whiskers indicate 5th and 95th percentile. j Western blot quantification shows similar decrease in LC3-II levels in iRPE treated with apical only and both apical and basal sides CC-HS treatment. In contrast, basal only CC-HS treatment shows lower LC3-II signal (N = 6 independent replicates and three experiments, iRPE1). P values were determined by multiple pairwise comparisons using two-tailed t test with 95% confidence interval and Bonferroni correction. The horizontal lines in the boxplots indicate the median, the boxes indicate the first and third quartiles, and the whiskers indicate 5th and 95th percentile. k Western blot quantification shows LC3-II levels are unaffected in iRPE treated with CI-HS, sera depleted in C5 or C3, or when cotreated with CC-HS and receptor blockers for C3aR1 (PMX53 10 μM) and C5aR1 (compstatin 10 μM), compared to CC-HS + vehicle (vehicle) treated samples (N = 5 biologically independent replicates, iRPE1, 4, 5, 8, 10; additional iRPE samples in Supplementary Fig. 6t). P values were determined by multiple pairwise comparisons using two-tailed t test with 95% confidence interval and Bonferroni correction. The horizontal lines in the boxplots indicate the median, the boxes indicate the first and third quartiles, and the whiskers indicate 5th and 95th percentile.

