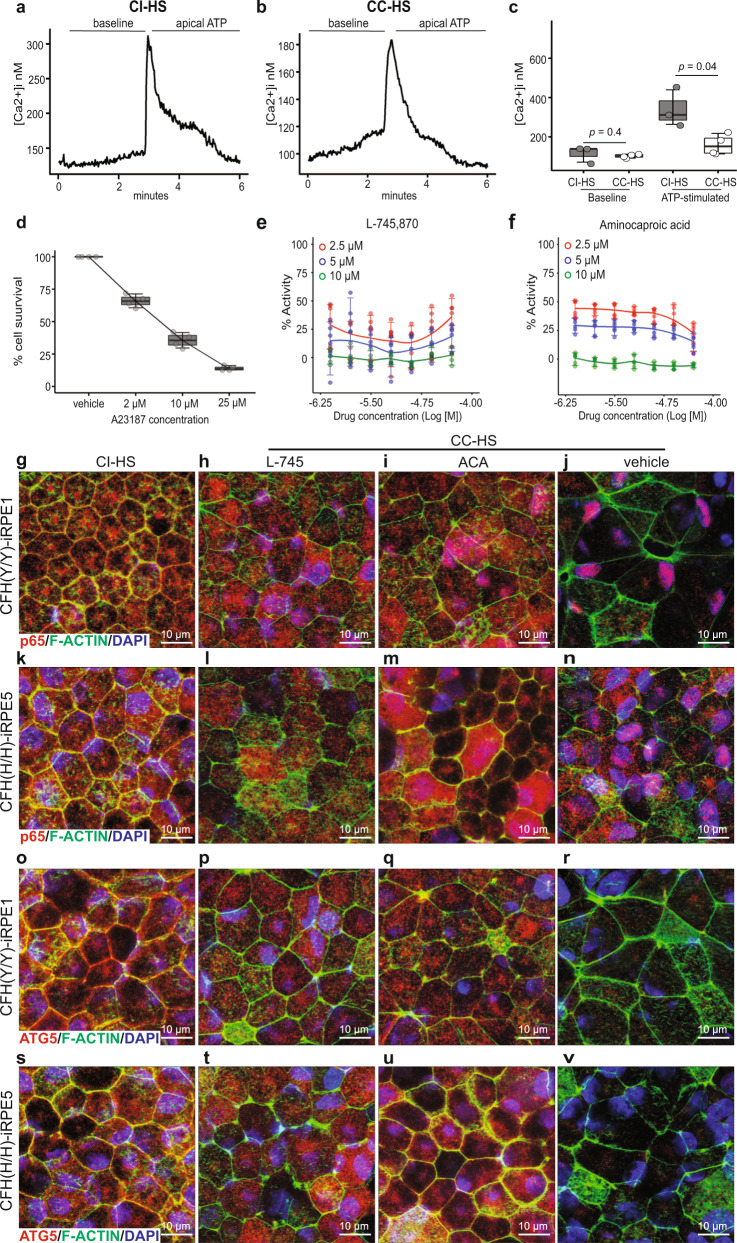
Fig. 6. High-throughput screen identifies drugs that restore NF-κB and autophagy pathways activity in CC-HS-treated CFH(Y/Y)-iRPE and CFH(H/H)-iRPE.
a–c Representative traces for intracellular Ca2+ ([Ca2+]i) changes in response to ATP stimuli in CI-HS- and CC-HS-treated iRPE cells (a, b; N = 4 independent experiments, iRPE8). c Boxplot shows similar baseline calcium levels and twofold lower ATP induced cytosolic calcium-level increase in CC-HS treated as compared to CI-HS treated iRPE (N = 4 independent experiments, iRPE8). P values were determined by pairwise comparisons using two-tailed t test with 95% confidence interval and Bonferroni correction. The horizontal lines in the boxplots indicate the median, the boxes indicate the first and third quartiles, and the whiskers indicate 5th and 95th percentile. d Survival curve of iRPE cells treated with calcium ionophore, A23187, performed at concentrations of 0, 2, 10, and 25 μM (N = 8 independent experiments, 8 technical replicates, iRPE4). e, f Seven-point dose response curves for L745 (e) and ACA (f), show reproducible cell survival across iRPE1 and 4, and three different A23187 concentrations (2.5 μM, red; 5 μM, blue; and 10 μM, green), N = 3 independent experiments. Error bars represent 90% confidence interval. g–n L745 and ACA suppress nuclear translocation of p65 (red) induced by CC-HS treatment on CFH(Y/Y)-iRPE and CFH(H/H)-iRPE; F-ACTIN (green), DAPI (blue). (N = 4 biologically independent replicates, iRPE1, 2, 5, 6). o–v L745 and ACA increase ATG5 (red) expression in CFH(Y/Y)-iRPE and CFH(H/H)-iRPE cells treated with CC-HS. F-ACTIN (green), DAPI (blue) (N = 4 biologically independent replicates, iRPE1, 2, 5, 6).

