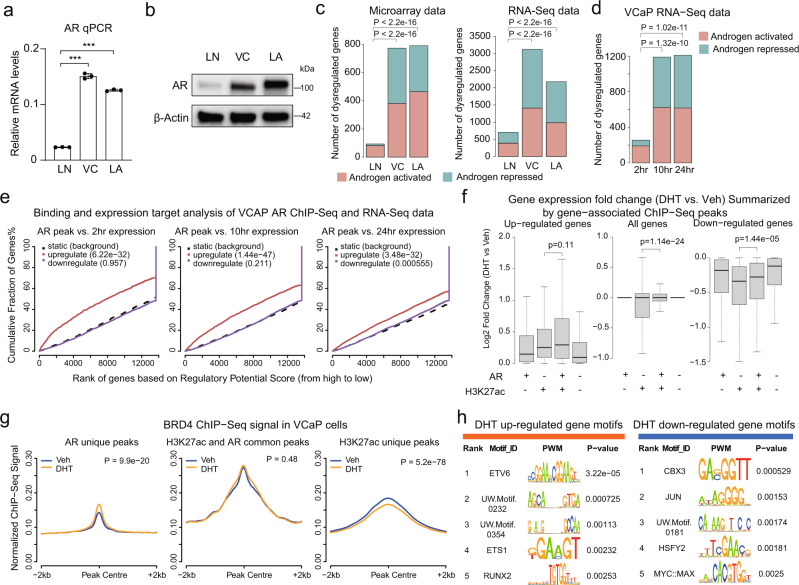
Fig. 1. Global transcriptome assessment identifies a disassociation between AR and androgen-elicited transcriptional repression.
a RT-qPCR for AR mRNA in LNCaP (LN), VCaP (VC), and AR-overexpressing LNCaP (LNCaP-AR, or LA) cells. Data are mean values ± SD for three biologically independent samples. P values are two-sided Student’s t test. ***, P < 0.001. b Western blot of AR in LNCaP, VCaP, and AR-overexpressing LNCaP cells, representative of three replicates. c Statistics of androgen-regulated genes. For microarrays, LNCaP is from Xu et al.21 LNCaP-AR is from GSE62474. VCaP is from GSE62473. Cutoff for androgen-activated genes is fold change > 1.5 and adjusted P < 0.05. Cutoff for androgen repressed genes is fold change < 2/3 and adjusted P < 0.05. RNA-seq data for LNCaP is from Liang et al.59. LNCaP-AR and VCaP RNA-seq data were generated in this report. Cutoff for DHT-stimulated genes, fold change > 2 and adjusted P < 0.05; cutoff for DHT-repressed genes, fold change < 1/2 and adjusted P < 0.05. Chi-squared test determined whether the numbers of regulated genes are different. d Statistics of DHT-regulated genes at different time points in VCaP. Cutoff for androgen activated genes, fold change > 2 and adjusted P < 0.05; cutoff for DHT-repressed genes, fold change < 1/2 and adjusted P < 0.05. Chi-squared test determined if the ratio of regulated genes is different. e Binding and expression target analysis (BETA) for association between AR binding in VCaP cells assessed by ChIP-seq at 12 h after DHT-stimulation (GSE55062) and DHT-driven gene expression at different time points in VCaP cells. Red line indicates DHT-upregulated genes, purple line indicates DHT-downregulated genes. f Boxplots show expression fold changes, which were classified into AR only, H3K27ac only, H3K27ac/AR common, or None groups based on H3K27ac or/and AR occupancy at ±10 Kb regions of gene TSSs. Box limits, 1st and 3rd quartiles; whiskers, 1.5× inter-quartile range; center line, median. From the left to right, n = 1090, 7989, 591, 2892, 5742, 25829, 1876, 19010, 1527, 12663, 600, and 4351, respectively. P values by two-sided Wilcoxon rank-sum test. g Average ChIP-seq signal of BRD4 (GSE55062) around peak centers at AR unique peaks, AR and H3K27ac common peaks, and H3K27ac unique peaks. ±2 kb region of peak centers were binned by 50 bp windows. h Motif enrichment at H3K27ac peaks annotated to DHT-upregulated genes (704 peaks) or DHT-downregulated genes (336 peaks) at 2 h time point. H3K27ac peaks within ±20 kb region of gene TSS were selected. Source data are provided in Histogram and Immunoblot Source Data files.

