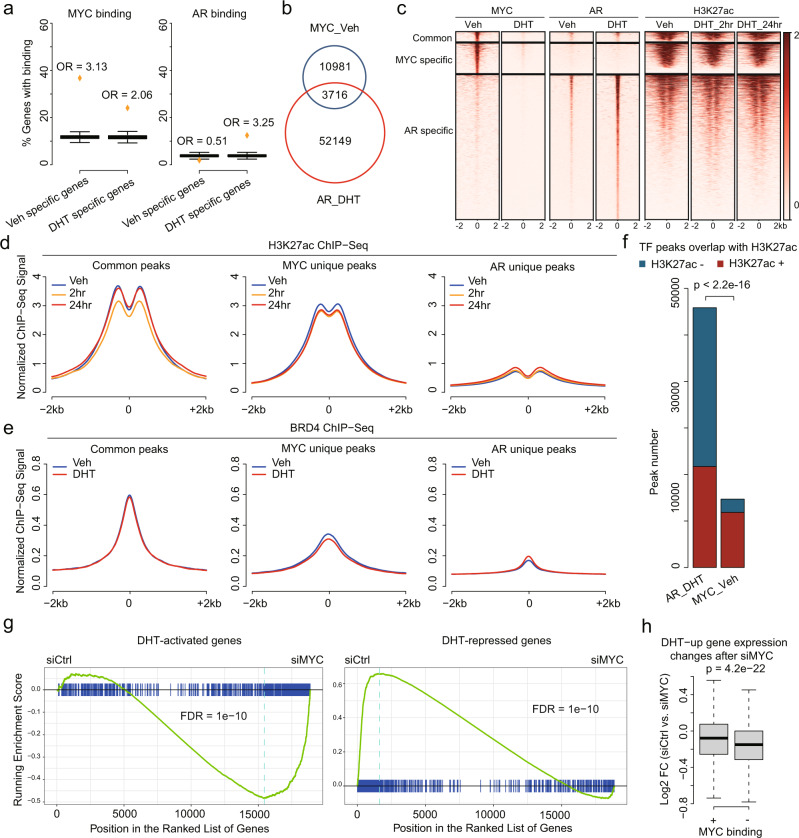
Fig. 3. Functional interaction between MYC and AR proteins.
a Enrichment analysis of vehicle-specific or DHT-specific genes with MYC or AR ChIP-seq peaks in proximity to (±20 kb) the TSSs. Orange points represent actual vehicle-specific or DHT-specific gene sets. Boxes represent 1,000 times random sampling from the whole transcriptome. Same number of genes as in the vehicle-specific and DHT-specific gene sets were used for random sampling, respectively. Odds ratio (OR) was calculated by comparing the percentage between actual gene sets and the average of random sampling. From the left to the right, P < 2.2e-16, P < 2.2e-16, P = 1 and P < 2.2e-16, respectively, by one-sided Student’s t test. Box limits, 1st and 3rd quartiles; whiskers, 1.5× inter-quartile range; center line, median. From the left to right, n = 1292, 1212, 1292, and 1212, respectively. b Venn diagram showing the overlap between MYC ChIP-seq peaks under vehicle condition and AR ChIP-seq peaks under DHT condition in VCaP cells. The MYC peaks overlapping with AR peaks are counted as common peaks. c Heatmaps showing the ChIP-seq signal of MYC, AR, and H3K27ac at MYC/AR common peaks, MYC-specific peaks, and AR-specific peaks in VCaP cells with or without DHT. d Pileup of H3K27ac ChIP-seq signal at MYC/AR common peaks, MYC-specific peaks, and AR-specific peaks in VCaP cells with or without DHT. e Pileup of BRD4 ChIP-seq signal at MYC/AR common peaks, MYC-specific peaks and AR-specific peaks in VCaP cells with or without DHT. f Barplot showing the number of liganded-AR and MYC peaks overlapping with enhancers (as marked by H3K27ac) in VCaP. The P value was determined by Chi-squared test. g Gene Set Enrichment Analysis (GSEA) using DHT-activated genes and DHT-repressed genes as gene sets to determine whether these two gene sets were regulated by MYC in complete FBS medium. h Boxplot showing log2 fold changes (siCtrl vs. siMYC) in complete FBS medium of DHT-upregulated genes. These genes were separated into two groups based on MYC binding status. Box limits, 1st and 3rd quartiles; whiskers, 1.5× inter-quartile range; center line, median. From the left to right, n = 392 and 216, respectively. P value was determined by two-sided Wilcoxon rank-sum test.

