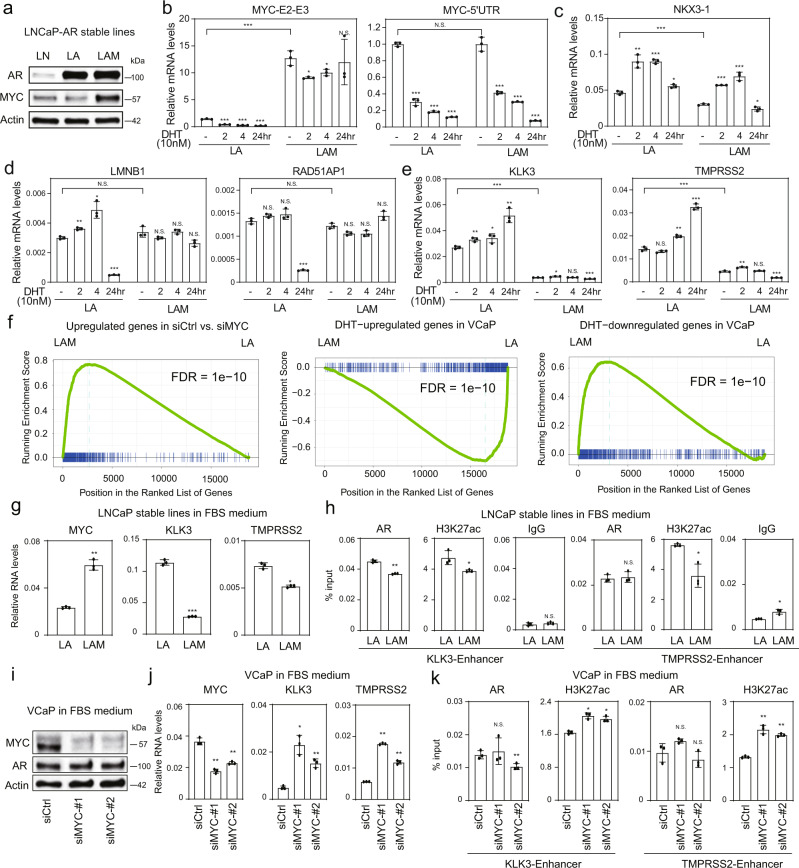
Fig. 4. MYC alters androgen-responsive transcriptome by mediating co-factor redistribution.
a Western blot analysis of AR or AR/MYC overexpression in LNCaP cells. LN, LNCaP; LA, LNCaP-AR; LAM, LNCaP-AR-MYC. The experiment was repeated independently three times with similar results. LNCaP-AR (LA, for AR overexpression) and LNCaP-AR-MYC (LAM, for AR and MYC overexpression) were cultured in androgen-depleted medium and treated with DHT for indicated time-points. Total RNA was subjected to real-time RT-PCR analyses. MYC-5’-UTR was based on primers targeting MYC-5’ UTR region; MYC-E2-E3 was based on primers spanning MYC exon-2 and exon-3 regions (b). The relative expression of MYC and AR targets was also determined by RT-qPCR (c–e). f Gene Set Enrichment Analysis (GSEA) using upregulated genes in siCtrl vs. siMYC (in complete FBS medium), DHT-activated genes, and androgen-repressed genes as gene sets (all from VCaP cells) to determine whether these two gene sets were regulated by MYC overexpression in LNCaP-AR cells. g RT-qPCR to determine MYC, KLK3, and TMPRSS2 mRNA levels in LA and LAM cells in full FBS medium. h ChIP-qPCR to determine AR and H3K27ac signal at KLK3 and TMPRSS2 enhancers in LA and LAM cells within full FBS medium. i Western blot analysis of MYC knockdown in VCaP cells. The experiment was repeated independently three times with similar results. j RT-qPCR to determine MYC, KLK3, and TMPRSS2 mRNA levels in VCaP cells in full FBS medium. k ChIP-qPCR to determine AR and H3K27ac signal at KLK3 and TMPRSS2 enhancers in VCaP cells in full FBS medium. For b–e, g, h, j, and k, data are presented as mean values ± SD; for each test, n = 3 biologically independent samples. For b–e, P values were determined by Wilcoxon Rank Sum Test and the multiple tests were further corrected by Bonferroni-Holm method; N.S., not significant; *, adjusted P < 0.05; **, adjusted P < 0.01; ***, adjusted P < 0.001. For g, h, j, and k, P values were calculated by two-sided Student’s t test; N.S., not significant; *, P < 0.05; **, P < 0.01; ***, P < 0.001. Source data are provided in Histogram and Immunoblot Source Data files.

