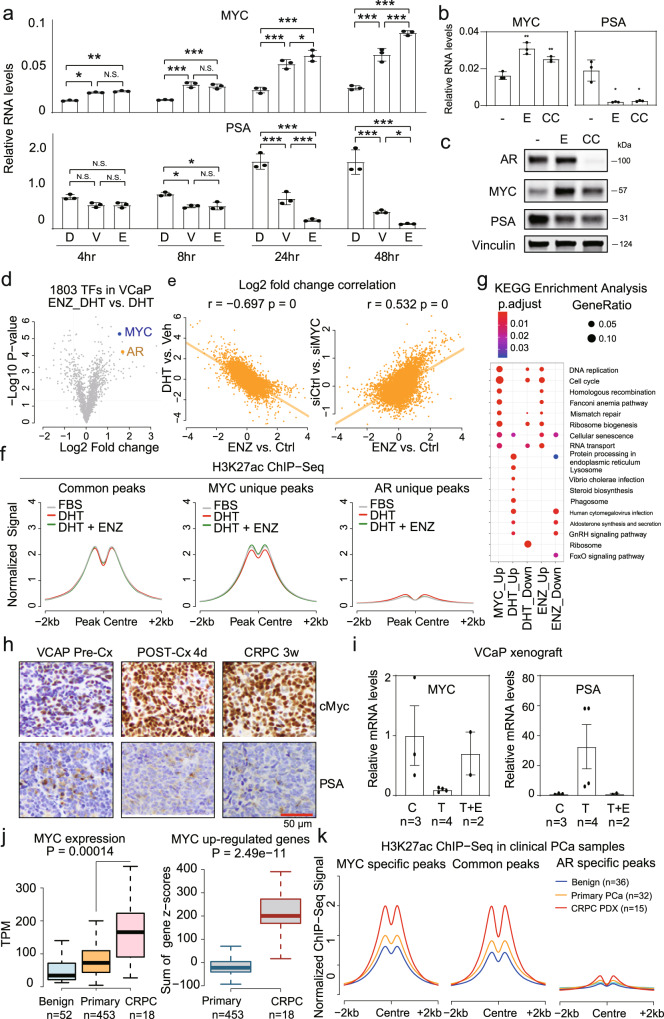
Fig. 5. MYC signature is activated upon immediate castration in compensation of AR pathway.
a VCaP cells in androgen-proficient medium (10% FBS + 10 nM DHT, or D) and then DHT removal (10% FBS + vehicle, or V) or anti-androgen treatment (10% FBS + 10 μM ENZ, or E) for indicated time points were assessed by qRT-PCR. Data are mean values ± SD for three biologically independent samples. P values were determined by one-way ANOVA. N.S., not significant; *, P < 0.05; **, P < 0.01; ***, <0.001. VCaP cells in androgen-proficient medium (10% FBS + 10 nM of DHT) and were treated with enzalutamide (10% FBS + 10 μM of ENZ, E) or an AR degrader ARCC-32 (CC, 500 nM) for 24 hrs and assessed by qRT-PCR (b) and Western blotting (c). Data in b are mean ± SD of three independent samples; P values were determined by two-sided Student’s t test. N.S., not significant; *, P < 0.05; **, P < 0.01. Blot in c is representative of three experiments. d Volcano plot showing expression changes of all human TF genes caused by ENZ in VCaP cells. e Left: reverse correlation between ENZ-elicited and DHT-elicited expression changes; Right: correlation between expression changes in response to ENZ versus MYC knockdown. f H3K27ac ChIP-seq signal at MYC/AR common peaks, MYC-specific peaks, and AR-specific peaks in VCaP cells in FBS medium ± DHT or DHT + ENZ. g KEGG pathway enrichment analysis of MYC-regulated genes, DHT-regulated genes, and ENZ-regulated genes. Pathways of MYC-downregulated genes were below the threshold. h VCaP xenografts precastration, 4 days postcastration, and at relapse (CRPC 3 weeks) analyzed by IHC for MYC and PSA. Data are representative of 3 mice at the 4 day postcastration point, and 5 mice at the other times. i VCaP xenografts that relapsed after castration were sacrificed (C, 3 mice) or were treated for 2 days with testosterone ± ENZ (T, 4 mice or T + E, 2 mice), and assessed by qRT-PCR for MYC and PSA. Data are mean ± SE for the 2–4 mice. j MYC expression and z-scores for MYC-upregulated genes in clinical benign (TCGA), primary PCa (TCGA), and CRPC (patients who relapsed after ADT) RNA-seq data (phs001648.v1.p1). Samples with AR or MYC amplification were excluded. Box limits, 1st and 3rd quartiles; whiskers, 1.5× inter-quartile range; center line, median. From the left to right, n = 52, 453, 18, 453, and 18, respectively. P values were determined by two-sided Wilcoxon rank-sum test. k H3K27ac ChIP-seq for MYC/AR common peaks, MYC-specific peaks, and AR-specific peaks in clinical samples from GSE130408. Source data are provided in Histogram and Immunoblot Source Data files.

