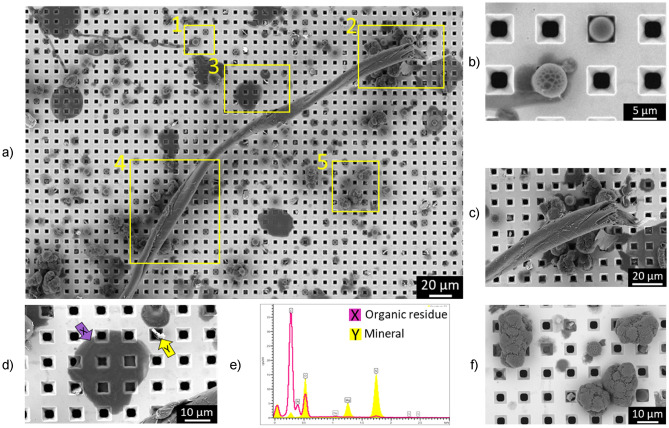
Figure 3.
SEM–EDX analysis of a part of the filtered area for a spiked commercial cow’s milk sample (brand C, skimmed milk, 0.1% fat) showing: (a) different yellow zones (numbered 1 to 5) with different types of particles identified in each zone. Zone 1 = PS and PMMA beads; zone 2 = undigested organic fiber with agglomerates of other particles including polymer standards; zone 3 = organic residue and mineral particle; zone 4 = undigested fiber; zone 5 = polymer beads (PMMA, PS) and PA particles; (b) magnified zone 1 showing PS and PMMA beads; (c) magnified zone 2 showing agglomerates of PMMA, PS and PA particles stuck to end of the fiber; (d) magnified zone 3 showing some organic residue and mineral particles; (e) EDX spectrum on the organic residue (X) and mineral particle (Y) present in panels D; (f) magnified zone 5 showing PA particles and PMMA/PS beads.

