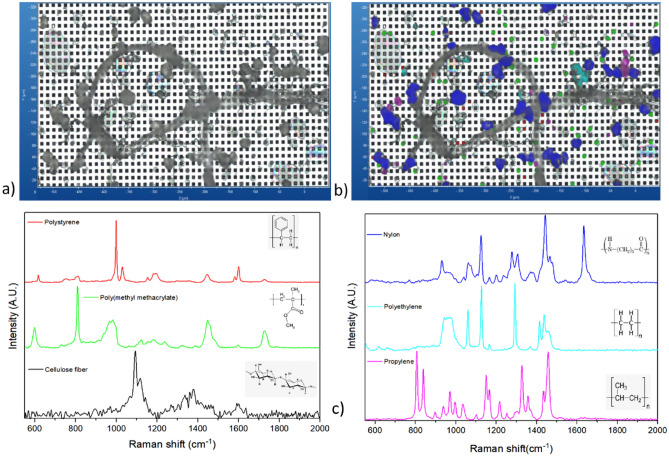
Figure 4.
µRaman analysis of a part of the filtered area for a cow’s milk (brand C, skimmed milk, 0.1% fat) spiked with 5 standards of MPs: (a) optical microscope image of digested particles on a part of the Si filter; (b) Same image with MPs and cellulose fiber detected and identified (PS colored in red, PMMA in green, cellulose fiber in gray, PA in blue, PE in cyan and PP in pink); (c) related colored Raman spectra collected from 5 MP standards and cellulose fiber after sample digestion.

