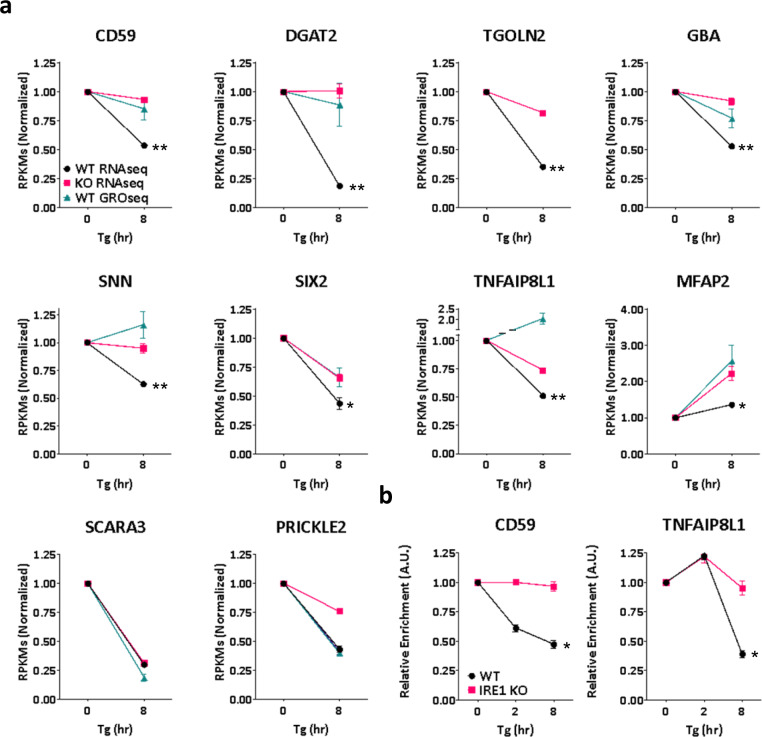
Fig. 1. Integrative RNAseq and GROseq analyses identify human RIDD and RIDDLE targets.
a Mean RPKM values for various examples of IRE1α RNase targets from the RNAseq and GROseq datasets in WT and IRE1α KO MDA-MB-231 cells before and after ER-stress induction by Tg (100 nM). Note that the GROseq data points in some cases are hidden behind the RNAseq data points. n = 3 biologically independent experiments. Data are presented as mean values ± SEM. An Unpaired t-test was used to calculate p-values. b Kinetic RT-qPCRs analysis of CD59 and TNFAIP8L1 transcripts in IRE1α WT and KO MDA-MB-231 cells, before and after ER-stress induction by Tg (100 nM) for 2 and 8 h. n = 3 biologically independent experiments. Data are presented as mean values ± SEM. An Unpaired t-test was used to calculate p-values. *P ≤ 0.05; **P ≤ 0.01.

