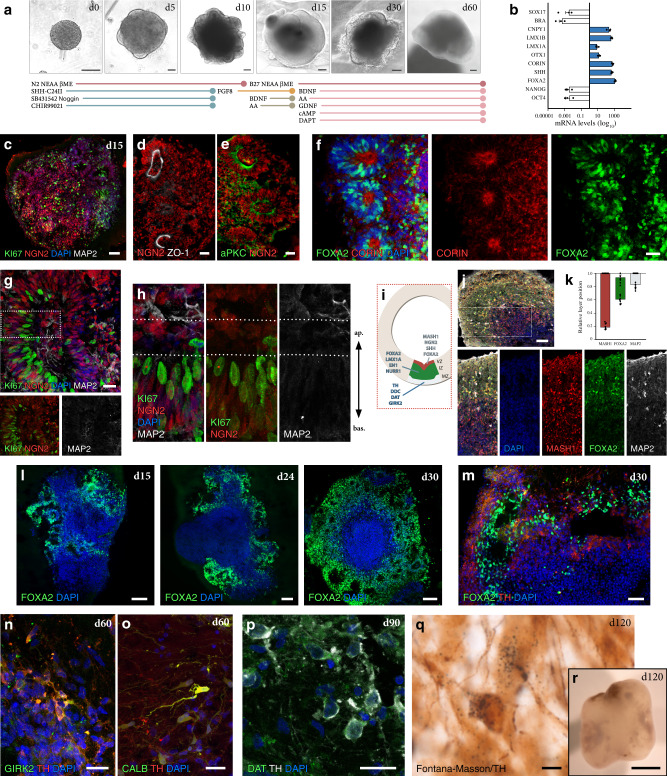
Fig. 1. Dopamine neurogenesis in VM organoids.
a Representative bright-field images of ventral midbrain (VM) organoid differentiation at different time points (upper) and schematic overview of the experimental design (lower). Scale bars, 200 µm. b qRT-PCR of selected markers at day 15 of VM organoid differentiation. The results are given as fold change over undifferentiated hPSCs. Data represent mean ± SEM of 3 independent organoids. c–e Immunocytochemistry of (c) NGN2/Ki67/MAP2, (d) NGN2/ZO-1, and (e) NGN2/aPKC at day 15 during VM organoid differentiation. Scale bars, 50 µm. f Immunohistochemistry of FOXA2/CORIN and g NGN2/Ki67/MAP2 in VM organoid at day 15. Scale bars, 100 µm (f) and 50 µm (g). h High-power magnification of the inset in g. i Schematic representation of developing DA neurons in vivo showing genes expressed at different stages of development (MZ, mantle zone; IZ, intermediate zone; VZ, ventricular zone). j Immunohistochemistry of MASH1, FOXA2, and MAP2 showing layer-specific organization and k relative quantification of fluorescence staining in VM organoid at day 24. Data represent mean ± SEM of 7 independent VM organoids. Scale bar, 100 µm. l Immunohistochemistry of FOXA2 across a time course (day 15–30). Scale bars, 50 µm. m Cryosection of VM organoid at month 1 showing TH/FOXA2 double staining. Scale bars, 100 µm. n, o Immunohistochemistry of TH stained with GIRK2/CALB at day 60 and p with DAT at day 90. Scale bars, 50 µm (n, o) and 20 µm (p). q Fontana Masson/TH double-stained cryosection from long-term cultured VM organoid (month 4). Scale bars, 50 µm. r Representative bright-field image of VM organoid at month 4. Scale bars, 1 mm. Nuclei were stained with DAPI in g, h, j, l–p. Source data are provided as a Source Data file.

