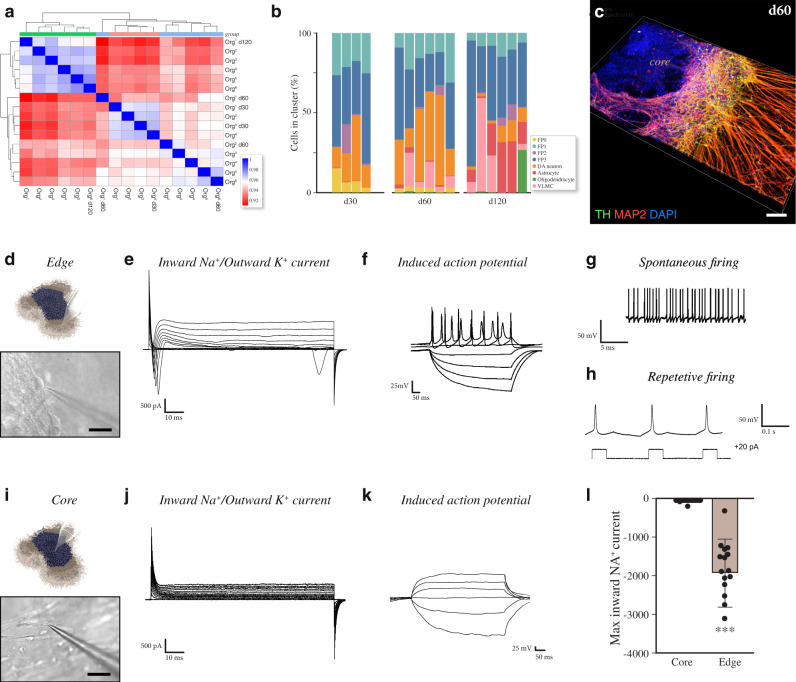
Fig. 4. Molecular and functional heterogeneity in human VM organoids.
a Clustering of sample to sample correlations (Pearson) of organoids and different timepoints using Euclidean distance on normalized and log‐transformed read counts. b Percentage of cells belonging to each cell cluster from individual organoids at days 30, 60, and 120. Intraclass correlation coefficient (correlation metric that considers group structure in the data) decreased from 0.717 at day 30 to 0.682 at day 60 and to 0.548 at day 120. c 3D reconstruction of an image stack from an 80 µm-thick optical section of TH and MAP2 immunohistochemistry at day 60. Scale bars, 100 µm. d Representative image of external functional recordings using whole-cell patch-clamp technique. Scale bars, 100 µm. e Representative trace from external patching showing inward sodium- and outward potassium-rectifying current traces of VM organoid at day 90 triggered by stepwise depolarization. f Patch-clamp recordings of external VM organoid cells depicting current-induced action potentials (APs) at day 90 (−85 pA to +165 pA with 20 pA steps). g External spontaneous firing at resting-membrane potential indicative of mature DA neuronal physiology in VM organoids at day 90. h Example trace of rebound depolarization after brief membrane depolarization (20pA) indicative of DA phenotype in externally located cells. i Representative image of internal functional recordings using whole-cell patch-clamp technique, Scale bars, 100 µm. j Representative inward sodium- and outward potassium-rectifying current traces of internally located cells at day 90 triggered by stepwise depolarization. k Patch-clamp recordings of internal VM organoid cells depicting the absence of current-induced APs at day 90 (−85 pA to +165 pA with 20 pA steps). l Inward sodium current quantifications in externally (n = 20) and internally (n = 16) localized cells within VM organoids at day 90. Data represent mean ± SD, unpaired two-tailed t-test, p = 0.0007. Source data are provided as a Source Data file.

