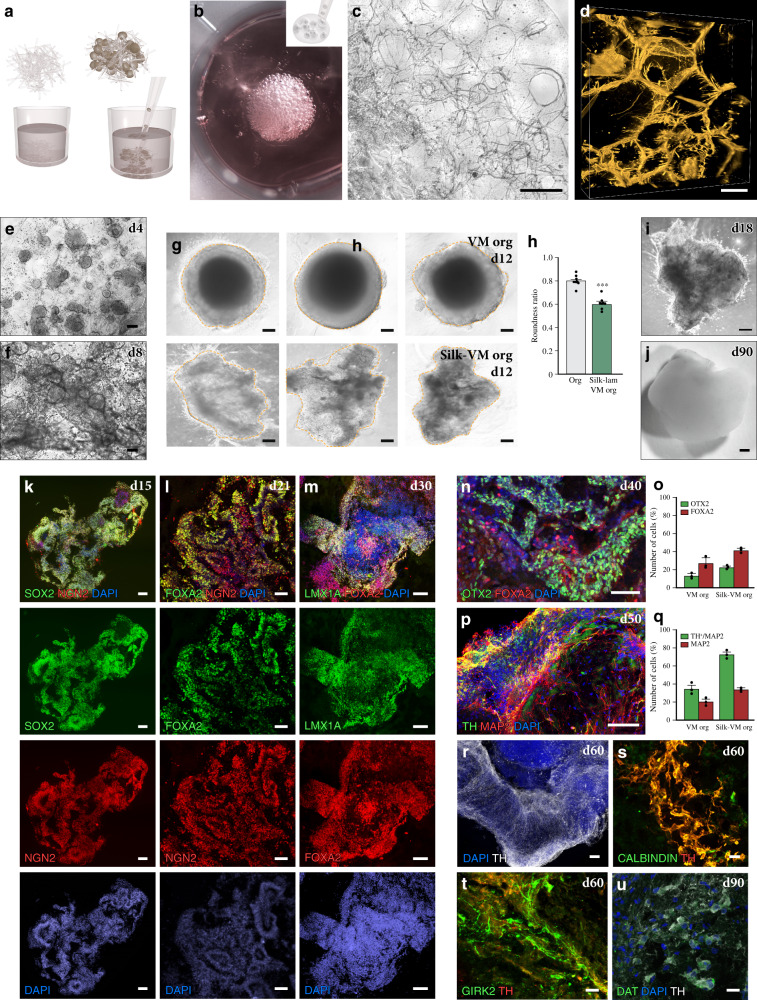
Fig. 5. Generation and characterization of silk-VM organoids.
a Schematic representation of silk-VM organoid generation. b Representative image of cells dispersed throughout silk foam. c Bright-field and d confocal images of 3D silk scaffold after reabsorption of foam. Scale bars, 50 µm. e, f Bright-field images showing adherence and growth of cells along the length of silk microfibers at days 4 and 8. Scale bars, 200 µm. g Representative bright-field images, and h, roundness measurement of VM organoids grown with and without scaffold at day 12. Scale bars, 100 µm. Data represent mean ± SEM of 8 biologically independent organoids, two-tailed Mann–Whitney test, ***p < 0.0001. i Representative bright-field images of a short-term and, j, long-term silk-VM organoid culture. Scale bar, 200 µm. k Immunohistochemistry of SOX2/NGN2 from organoid at day 15 and l–n FOXA2 across a time course from day 21 to 40, stained with NGN2 (l), LMX1A (m), and OTX2 (n). Scale bars, 100 µm (l, n) and 50 µm (k, m). o Quantifications of OTX2+ and FOXA2+ cells in VM and silk-VM organoids. Data represent mean ± SEM obtained from 3 independent organoids. p Immunohistochemistry of TH and MAP2 and q, quantifications of MAP2 and TH/MAP2 in VM and silk-VM organoids at day 50. Data represent mean ± SEM obtained from 3 independent organoids per condition. Scale bars, 100 µm. r Immunohistochemistry of TH and s, t with CALB1/GIRK2 at day 60. Scale bars, 20 µm. u Immunohistochemistry of TH stained with DAT at day 90. Scale bars, 20 µm. Nuclei were stained with DAPI in j–l, m, o, q and t. Source data are provided as a Source Data file.

