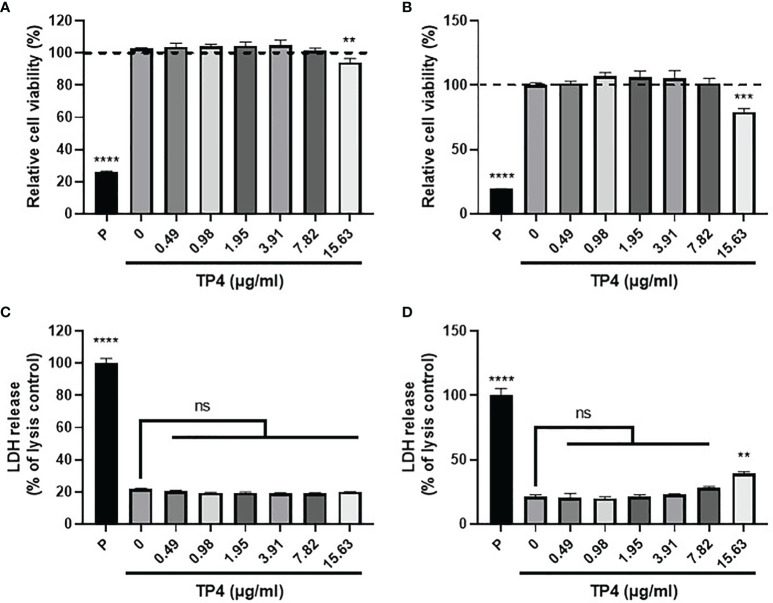
Figure 2.
Cytotoxicity of TP4 in GV sup-induced THP-1 macrophages (THP-1/GV) and vaginal epithelial VK2 cells. THP-1/GV (A) and VK2 cells (B) were treated with different doses (0.49, 0.98, 1.95, 3.91, 7.82, 15.63 μg/ml) of TP4 for 24 h and subjected to MTS/PMS assay. Triton-X 100 (0.1%) served as a positive control (P). Results are shown as relative percentage to 0 μg/ml group. THP-1/GV (C) and VK2 (D) cells were treated with different doses (0.49, 0.98, 1.95, 3.91, 7.82, 15.63 μg/ml) of TP4 for 24 h. After treatment, the supernatants were subjected to an LDH release assay. Triton-X 100 (0.1%) served as a positive lysis control (P). Results are shown as relative percentage to positive control. Data are presented as mean ± SD of three independent experiments (**P < 0.01; ***P < 0.001; ****P < 0.0001; ns, not statistically significant, compared to 0 μg/ml).

